- The consolidation of global and bilateral free trade agreements has empowered corporations to operate seamlessly across borders to the detriment of farmers and the environment.
- There has been a consistent pattern of dumping of agricultural commodities that has hurt family farmers in the global north and south and consolidated corporate power over supply chains.
- While U.S. production doesn’t dominate world markets as it once did, global traders can shift among suppliers and buyers, transferring risks to farmers.
While the original Crisis by Design accurately described the farm policies that drove increases in corporate concentration and the decimation of farm economies, it did not predict the expansion of global trade rules that came with the formation of the World Trade Organization (WTO) or the huge increase in bilateral and regional trade deals that go beyond WTO commitments. Those agreements were designed to facilitate exchanges of goods, services and investments across borders, not to promote fair or sustainable agricultural systems or economic development. They led to the expansion of U.S. based agribusinesses into other aspects of supply chains and the rise of transnational companies based in the U.S. and emerging economies.
The emergence of global, bilateral and plurilateral trade deals set the stage for many of these changes. In 1996, Renato Ruggerio, the first director general of the newly formed WTO proclaimed, “We are no longer writing the rules of interaction among separate national economies. We are writing the constitution of a single global economy.”1 He went on to insist that the new rules could rebalance the scales between rich and poor countries, but in fact, the WTO along with the North American Free Trade Agreement (NAFTA) and the countless bilateral and regional trade deals that followed have knitted economies together in ways that have lowered social and environmental protections. It was not developing countries who were empowered but instead vast corporations seamlessly operating across borders. This has been especially true in agriculture, where the traditional ABCD companies (Archer Daniels Midland/Bunge/Cargill/Dreyfuss) that had focused on grain trading expanded vertically and horizontally into other aspects of supply chains and, at the same time, were supplemented by foreign transnational corporations.2 Currently, the biggest meat company in the U.S. is the Brazilian JBS, the biggest pork company is the Chinese-owned Smithfield, and the biggest seed and pesticide company is the German-owned Bayer. In each case, the nominal nationality is much less important than its market power.
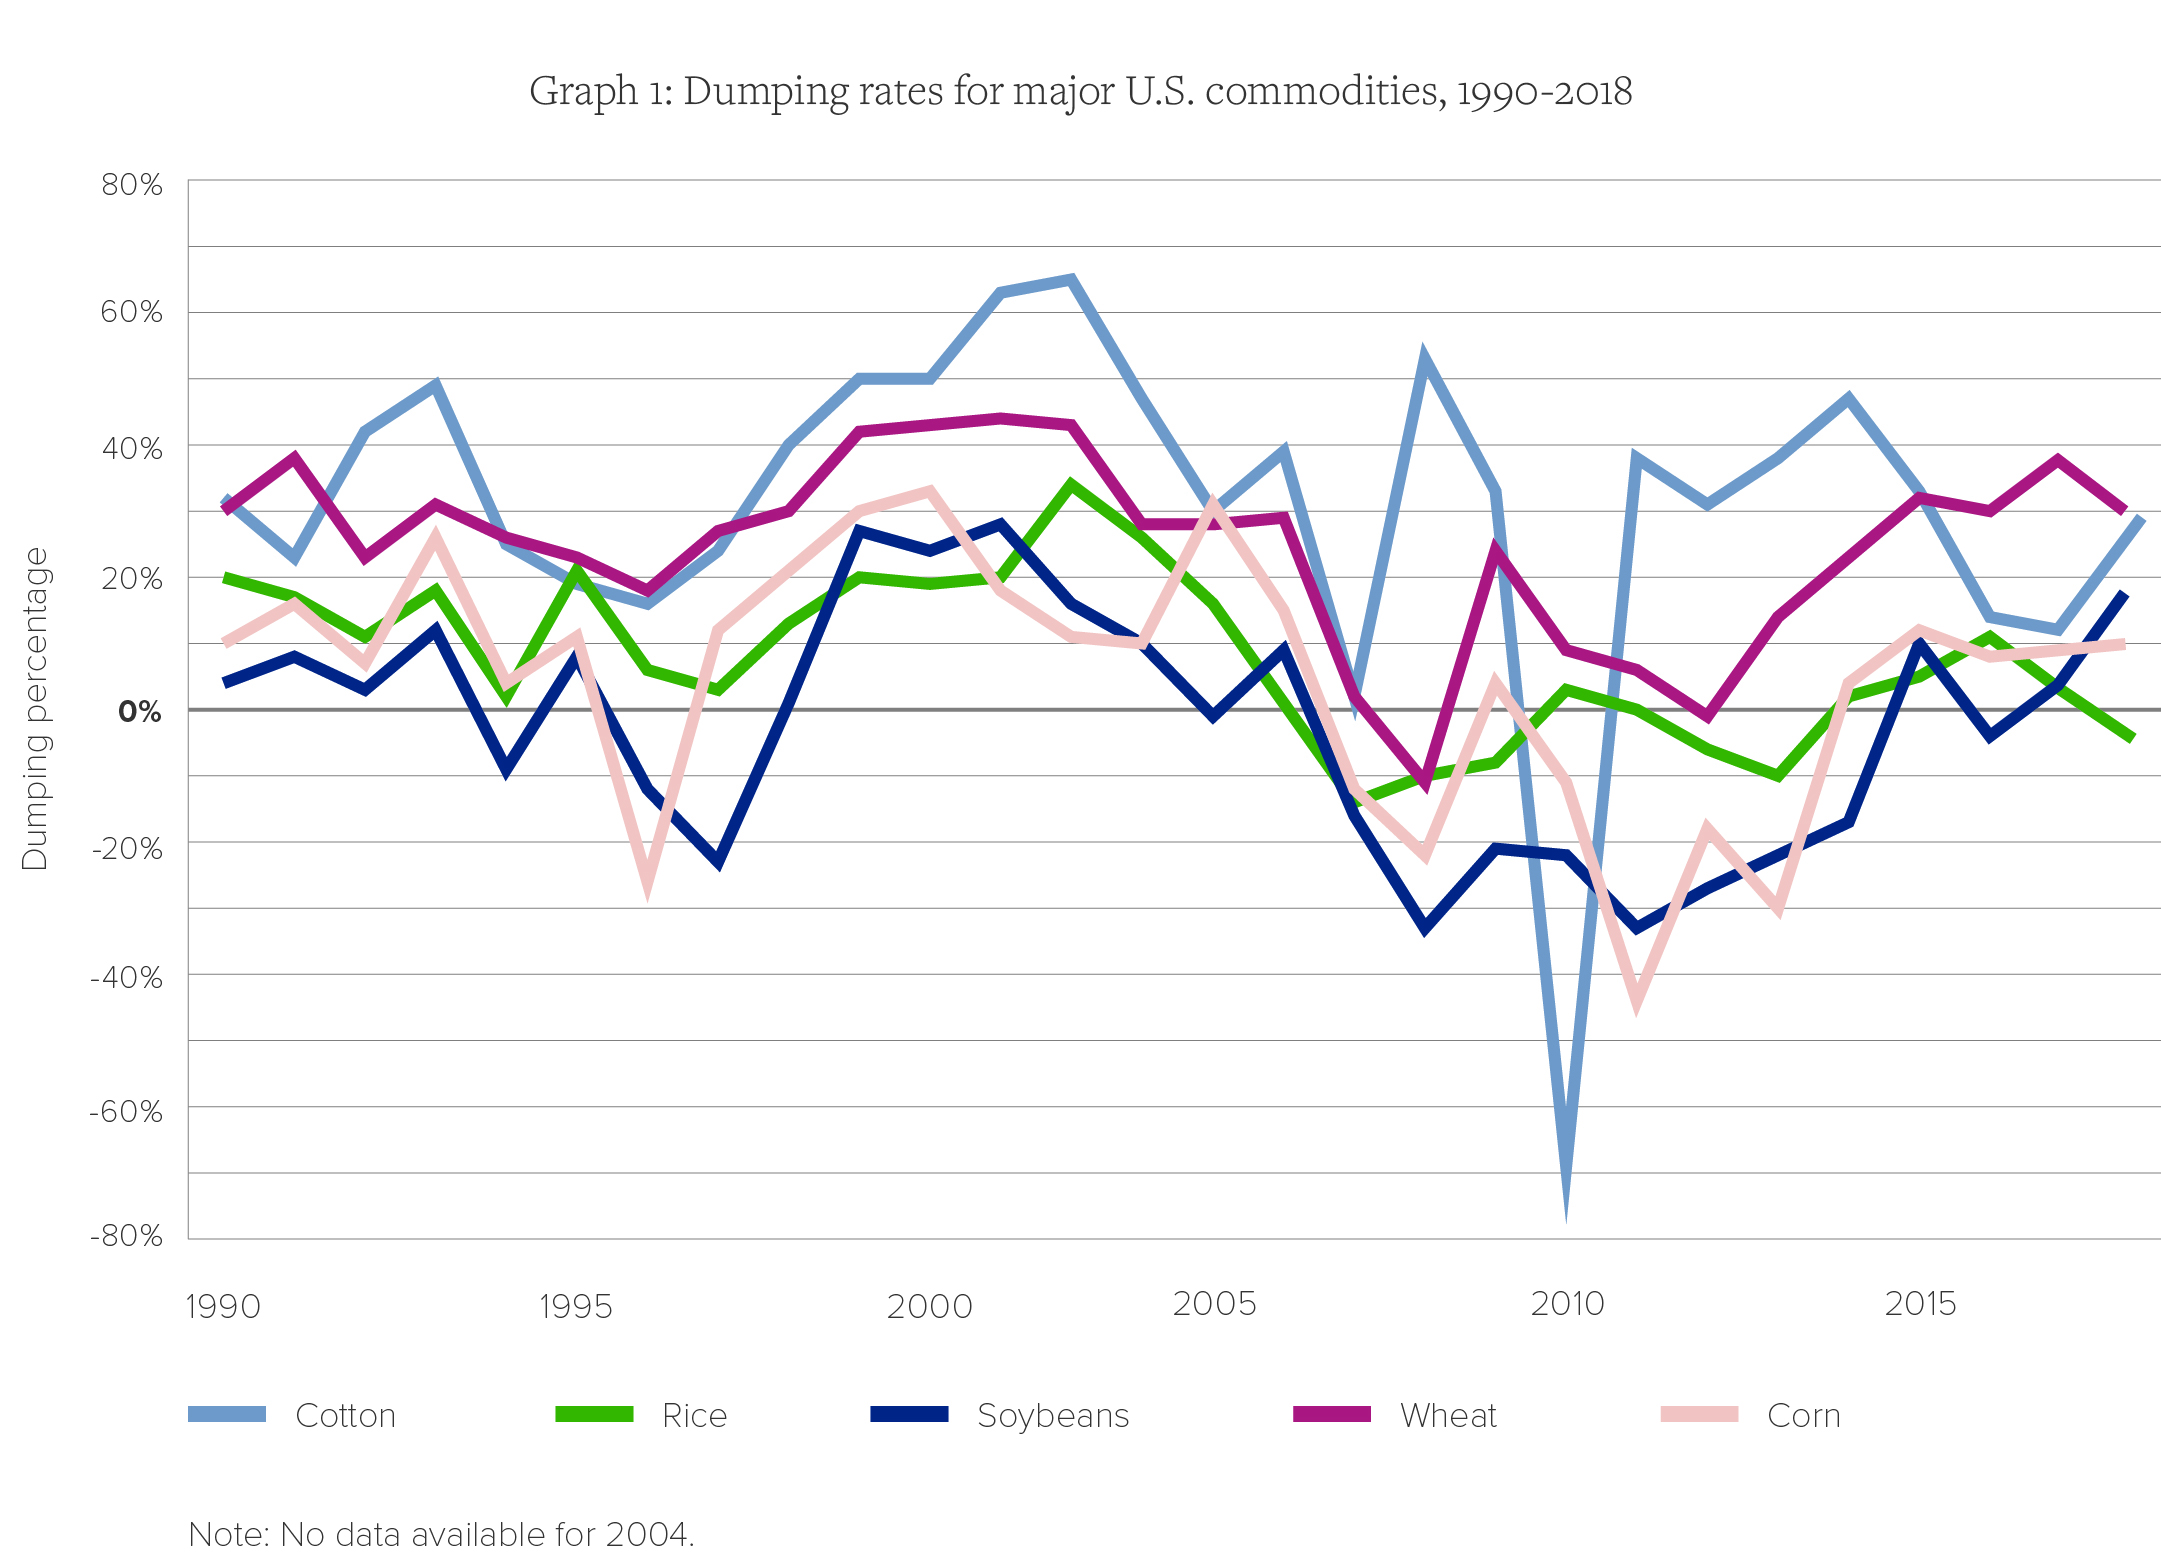
The famous imperative to “get big or get out” drove U.S. farmers to expand their production for export. IATP has been documenting the extent of dumping, i.e., exporting farm goods at below the cost of production since the late 1990s.3 With some brief exceptions, there has been a clear and consistent pattern of cheap exports invading global markets, to the detriment of farmers. As of 2018, the rates of dumping stood at 29% for wheat and cotton, 9% for corn, 17% for soybeans and negative 4% for rice.4
These cheap exports had devastating impacts on farmers both in the U.S. and developing countries. Under NAFTA, for example, U.S. exports of cheap corn to Mexico increased more than 400%. According to studies, some 4.9 million Mexican family farmers were displaced between 1991 and 2007, with about three million becoming seasonal workers in agro-export industries.5
The deregulation of U.S. financial and commodity markets, followed by renewable energy legislation that dramatically increased the demand for ethanol, and crop failures in Australia and Russia, led to a huge increase in commodity prices in 2007-2008. The Food Price Crisis led to riots in many developing countries. That initial price spike was repeated in 2011-2012 when a major drought in the U.S. caused grain prices to increase again. These periods of chaos in global markets created openings for corporations to consolidate power over supply chains to the detriment of farmers. When one family farm failed, it was often bought out by ever larger farms and corporations that sold goods into ever more concentrated supply chains. These firms are in the business of adding value to primary commodities, whether they are fattening animals or turning corn into ethanol. They are happy to keep farmgate prices low, since they can take profits at other points in the supply chain. In addition, their enormous size means they can sustain short-term prices swings or even profit from them, as long as they successfully predict the direction of those changes. Farmers, on the other hand, may defer losses temporarily but often cannot weather successive rounds of boom or bust.
U.S. production does not dominate world markets the way it once did. For example, in 1987, the U.S. exported 21 million tons of soybeans. It was by far the biggest exporter at that time, followed by Brazil with just 3 million tons. The U.S. export share held fairly steady until about 2007, when exports increased substantially as China became the leading importer. As of 2016, the U.S. exported nearly three times as much soybeans as it had in the 1980s (58 million tons), but now it is followed closely by Brazil at 52 million tons. In some years, Brazil exports more than the U.S. In 2015, Brazil exported 58 million tons of soy compared to 54 million from the U.S. China is by far the biggest soybean import market (84 million tons), followed by Mexico (4 million). While the U.S. is still the leading exporter of corn, with 56 million tons in 2016, the combined exports of Brazil and Argentina nearly match that amount. As of 2016, Russia was the lead exporter of wheat, with 25 million tons, followed by the U.S., Canada and France.6
Increased dependence on export markets has increased vulnerability. Trump’s imposition of tariffs led to retaliatory tariffs and decreases in purchases of U.S. goods by China. From October to July 2019, the U.S. exported 10.6 million metric tons of soybeans to China, compared to 25 million tons for the same period in 2018. Prices have dropped from around $10 a bushel in 2016 to near $8 a bushel as of September 2019. While they increased to about $9 a bushel after the announcement of “Phase One” of a trade arrangement between the U.S. and China, the damage caused by erratic markets and prices has not been resolved.
While Trump’s bailout program provided some temporary relief from those losses, the situation highlights farmers’ vulnerability to the whims of presidents and politics. Global grain traders will simply shift purchases to other countries, with farmers assuming the risks of these trade wars, as well as other forms of volatility caused by speculative investments and climate change.
There are some rays of hope. The original Crisis by Design reported on the problems caused by U.S. food aid. For many years, the U.S. used shipment of international in-kind food aid to absorb excess production and open new markets. Shipping U.S. food to countries in crisis, besides being much more expensive than providing cash for local and regional purchases, is much slower than arranging for local purchases. In some cases, by the time the food aid arrived, the initial crisis was over, and the aid shipments displaced local harvests.
After considerable advocacy from U.S. development NGOs, the 2008 Farm Bill included a pilot program to study local and regional purchase of food aid. The initial program was expanded and made permanent in the 2014 Farm Bill. It is still just a fraction of total food aid deliveries, but it has opened the door to future changes. These changes also help to debunk the notion that U.S. farmers must feed the world, instead of supporting national efforts to strengthen local food supplies.7
That change in narrative matters. The concept of food sovereignty — that each country has the right to democratically determine its own food system and to prioritize local needs over exports — has gained ground since it was introduced by La Via Campesina in Nyeleni, Mali in 2007. It coincides with a period in which U.S. farmers are questioning reliance on cheap commodity crops and grain exports. Unfortunately, U.S. farm and trade policy does not yet support a real shift in incentives.
Still, another consequence of globalization is that the U.S. can learn from experiences in other countries. Mexico has initiated a program to achieve self-sufficiency in corn and other basic grains, starting with production incentives for small-scale farmers that include guaranteed prices set to cover costs plus a reasonable return. Canada’s dairy supply management program provides important lessons on new ways to balance farmers’ needs for stability at prices that are fair to both farmers and consumers. Coupled with new efforts to rein in corporate power in the food system, those experiences could point the way to a new kind of farm program in the U.S., one that ensures parity, sustainability and equity, all central goals outlined in the original Crisis by Design.
Endnotes
- UNCTAD and WTO: A Common Goal in a Global Economy, Press Release TAD/INF/PR/9628 October 8, 1996, https://unctad.org/en/pages/PressReleaseArchive.aspx?ReferenceDocId=3607.
- Sophia Murphy, David Burch, Jennifer Clapp, “Cereal Secrets: The world’s largest grain traders and global agriculture,” Oxfam Research Reports, August 2012. https://www-cdn.oxfam.org/s3fs-public/file_attachments/rr-cereal-secrets-grain-traders-agriculture-30082012-en_4.pdf.
- Murphy S, Hansen-Kuhn K (2019), The true cost of US agricultural dumping, Renewable Agriculture and Food Systems 1-15. https://doi.org/10.1017/S1742170519000097.
- These calculations are based on official US government and OECD data. The government support cost and the cost of transportation and handling are added to the farmer production cost to calculate the full cost of production. The percent of export dumping is the difference between the full cost of production and the export price, divided by the full cost of production. Sources: Farmer production costs are from USDA Commodity Costs and Return. Government Support Costs are from OECD Producer Support Estimates Database. Transportation and export prices are based on information in USDA Agricultural Marketing Services Grain Transportation Report Datasets. For wheat, corn and soy, we used Table 2: Market Update: US Origins to Export Position Price Spreads. For rice we used Rice Yearbook, Table 17: Milled rice: Average price, f.o.b. mills, at selected US milling center. For cotton, we used the National Cotton Council of America’s A Index of global prices.
- John Scott, “Agricultural Subsidies in Mexico: Who Gets What?” In Subsidizing Inequality, Mexican Corn Policy Since NAFTA, Jonathan Fox and Libby Haight, eds., Wilson Center, 2010, Table 1, p. 76. Based on Mexican Agricultural Census data from 1991 and 2007. Available at: wilsoncenter.org/sites/default/files/Subsidizing%20Inequality_0.pdf.
- Data on soy, corn and wheat production is from the FAO and USDA World Agricultural Supply and Demand Estimates Report (WASDE) reports. http://www.fao.org/faostat/en/#data/TP/visualize. Also https://www.ers.usda.gov/data-products/foreign-agricultural-trade-of-the-united-states-fatus/us-agricultural-trade-data-update/#U.S.%20agricultural%20exports,%20year-to-date%20and%20current%20months.
- Congressional Research Service, U.S. International Food Assistance: An Overview, December 2018.
Download the PDF.
Read the introduction and the other eight pieces in the series.