Download a PDF of the report and find links to the appendix, methodology, datasets and translations of the report at the bottom of the page.
Profits versus the planet
On 25 March 2014, the top executives of the Brazilian meat giant JBS were in New York for the company’s annual “JBS Day,” where they announced the year’s financial results. The world’s largest producer of meat had a triumphant message for Wall Street: global meat consumption is going up and JBS is going to profit immensely from this growth.1 The Brazil-based company told shareholders that a pillar of its strategy is a projected 30 percent increase in per capita global meat consumption to 48 kg by 2030, up from 37 kg per person in 1999.2
JBS neglected to tell its investors about a critical problem with its growth strategy: climate change. If global meat production were to expand to 48 kg per capita, it would become impossible to keep global temperatures from rising to dangerous levels.3 To put the JBS numbers in perspective, a new Greenpeace report finds that average per capita meat consumption must fall to 22 kg by 2030, and then to 16 kg by 2050, to avoid dangerous climate change.4
JBS made no mention of climate change in its presentation but, as with the other global meat and dairy conglomerates, it should know the climate impacts of increasing production. More than a decade ago, the Food and Agriculture Organization of the United Nations (FAO) published the first global accounting of greenhouse emissions from meat and dairy, demonstrating global livestock’s role in exacerbating climate change.5 Subsequent studies have backed up this initial assessment.6 Despite these findings, the biggest meat and dairy companies remain committed to growth levels that are completely at odds with the agreement reached in Paris in 2015 by the world’s governments to keep the global temperature rise to “well below 2 degrees Celsius (°C),” with the goal of limiting it to 1.5 °C.7
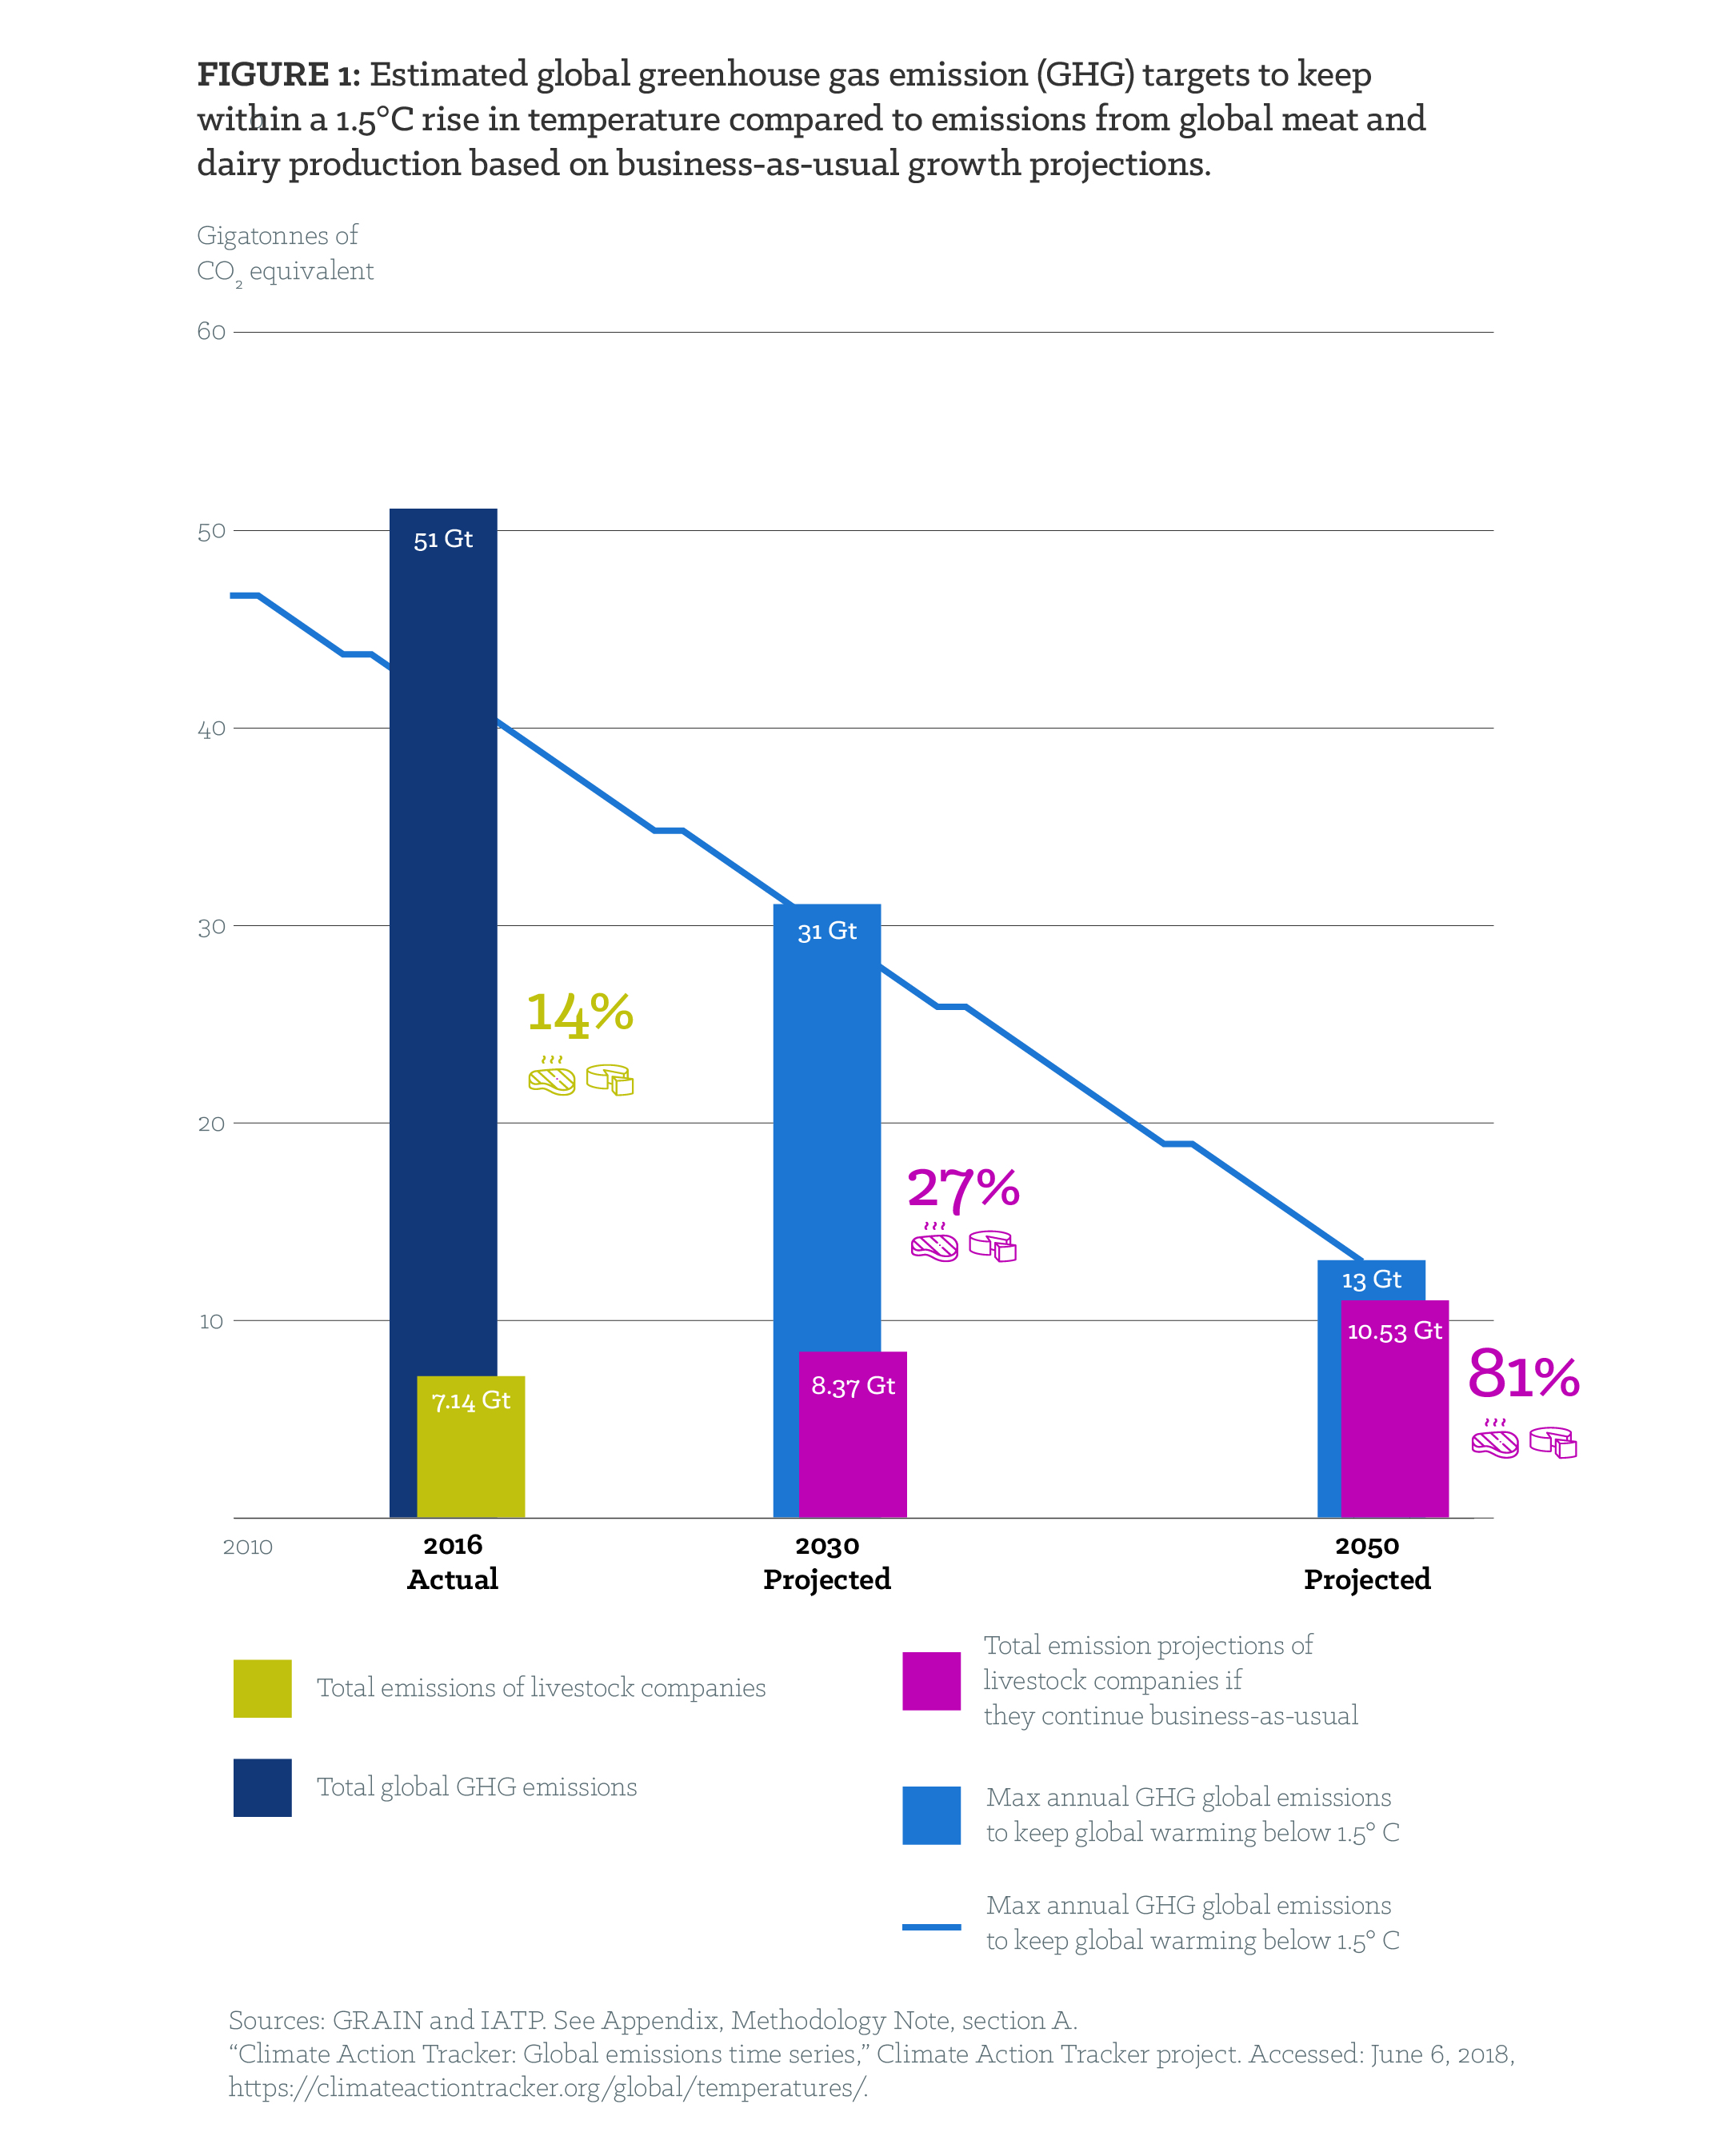
If we are to reach the 1.5 °C goal, total global emissions must rapidly decline from 51 gigatons to 13 gigatons8 by 2050 (Figure 1). If energy, transport and other sectors successfully cut emissions in line with the Paris objectives while meat and dairy companies continue to increase production, the livestock sector will account for a larger and larger portion of the world’s available GHG emissions budget of 13 gigatons. Under a business—as—usual scenario, the livestock sector could eat up over 80 percent of the budget, making it virtually impossible to keep temperatures from rising to dangerous levels past 1.5 °C.9
In direct contradiction to JBS’s outlook for strong growth, the imperatives of climate change necessitate a significant scaling back of production from the world’s largest meat and dairy companies without delay.
This report focuses on the biggest players in the meat and dairy industry. The stakes could hardly be higher: without dramatic cuts in their GHG emissions, the world may well fail in its attempts to avert catastrophic climate change. Not only do these companies have a massive climate footprint—comparable to major fossil fuel companies—but they dominate meat and dairy production in those parts of the world where there is both surplus production and high levels of meat and dairy overconsumption.10 These are the parts of the world where steep reductions in emissions from meat and dairy production are most necessary. This includes exports that fuel overconsumption amongst the more affluent middle and upper classes of developing countries.
Box 1: The full scope of meat and dairy emissions
Emissions calculations are highly dependent on where one sets system boundaries. To properly capture and quantify all emissions from a given food product or corporation, it is important to count all emissions, including those categorised as:
- Scope 1: Direct emissions from company—owned facilities, processing plants, and machinery, perhaps from natural gas or coal combustion to produce process heat; some companies may include the emissions generated by animals’ digestive systems at company—owned farms.
- Scope 2: Off—site emissions, including emissions from electricity generation.
- Scope 3: Upstream and downstream “product chain” emissions consisting of on—farm emissions from livestock, manure, farm machinery fuel, livestock feed production, production of the inputs needed to produce that feed (e.g., nitrogen fertiliser), land—use changes triggered by the expansion of livestock grazing and feed production, and other sources.
Scope 3 captures the lion’s share of emissions from a given company or food product in the meat and dairy sector. It is critical to include all Scope 1, 2 and 3 emissions if one is to meaningfully answer a question such as “what quantity of GHGs does Cargill emit into the atmosphere from its meat production processes?” Unfortunately, most companies report only narrow assessments of Scope 1 and 2 emissions.
The climate footprint of the meat and dairy giants
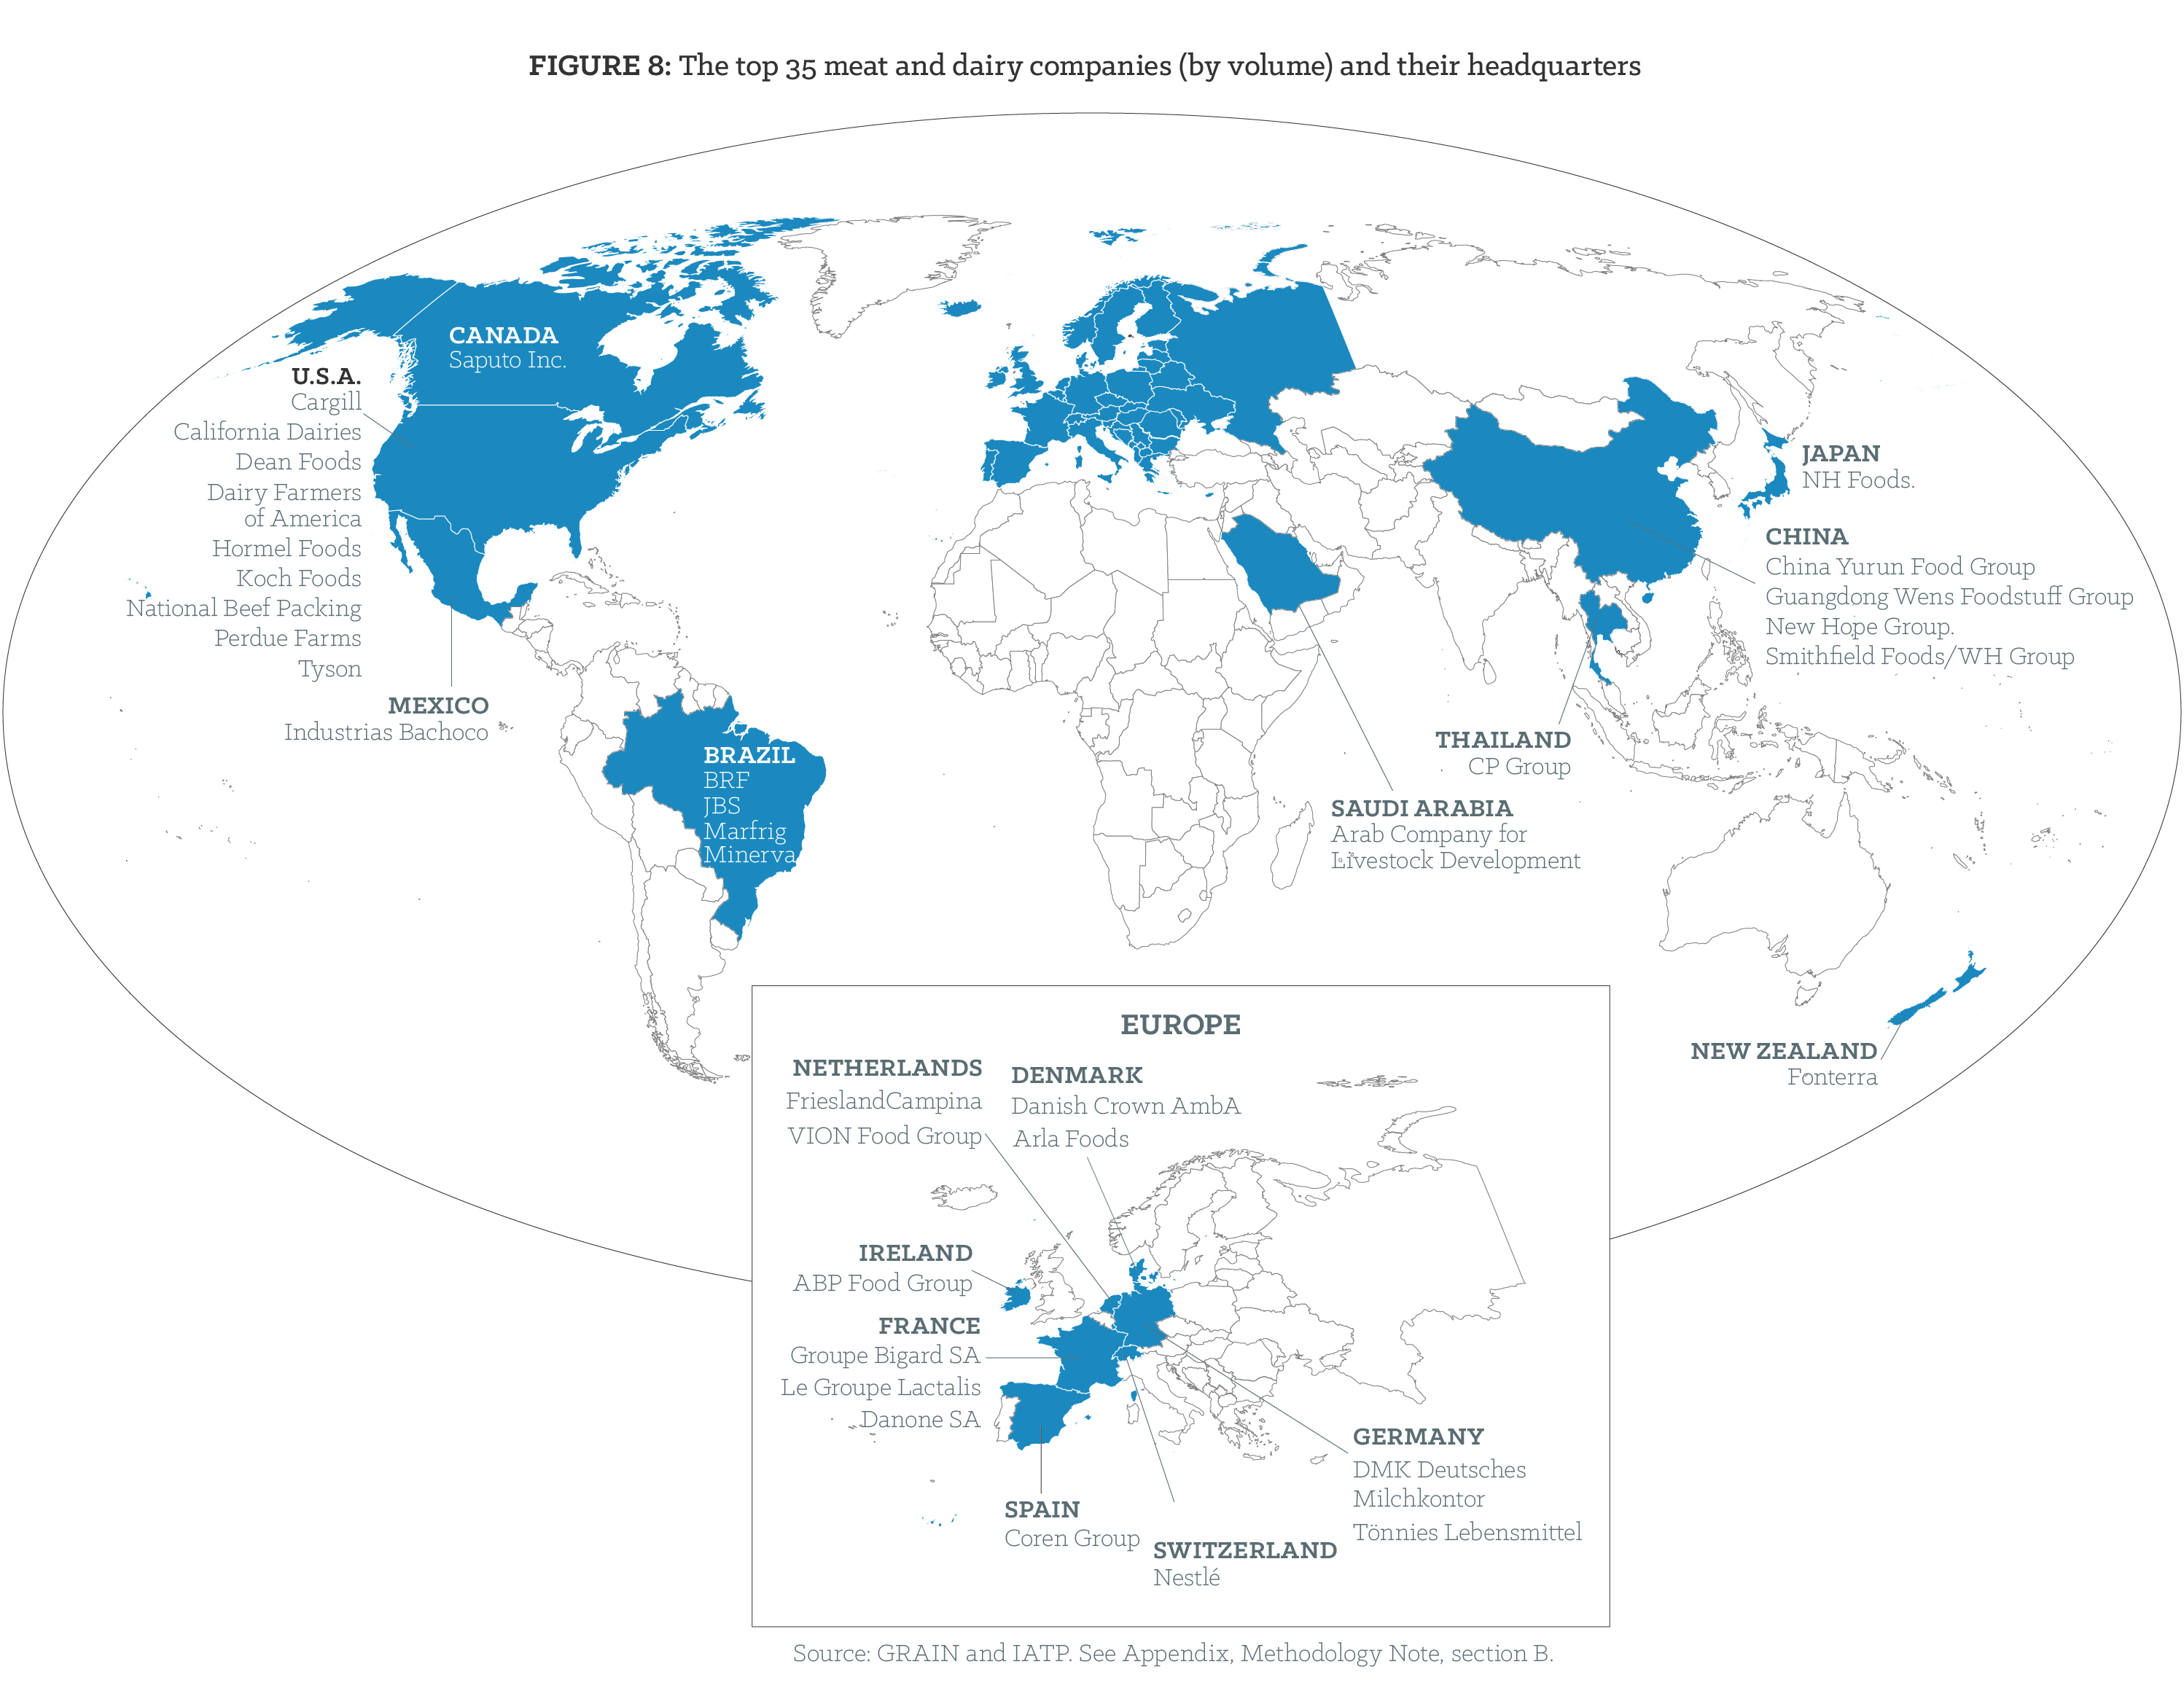
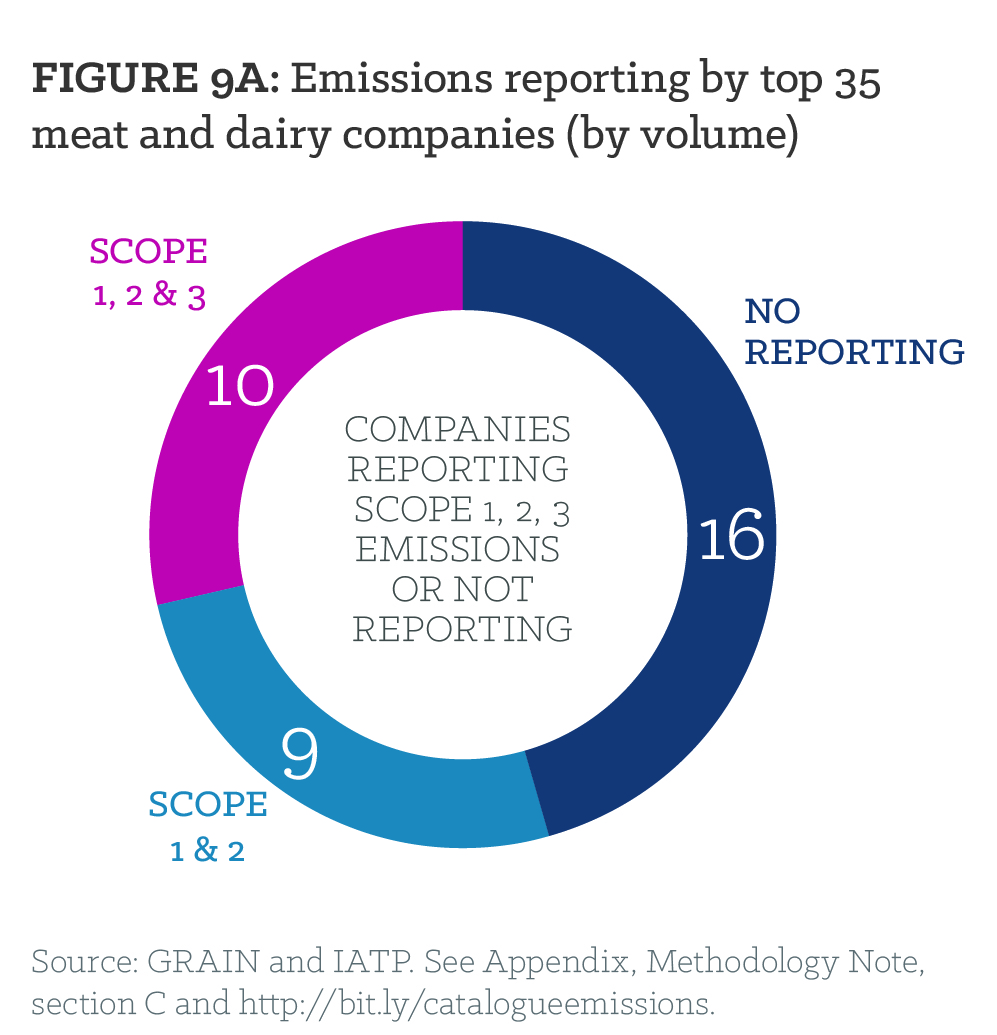
Unlike their counterparts in the energy sector, the big meat and dairy companies have thus far escaped public scrutiny of their contribution to climate change. The lack of public information on the magnitude of their GHG footprints is one contributing factor. GRAIN and IATP have reviewed the efforts undertaken by the world’s 35 largest11 beef, pork, poultry and dairy companies to quantify their GHG emissions. We found the publicly available data on their emissions to be incomplete, not comparable between companies or years and, in the majority of cases, simply absent (Figure 9). Only four companies—NH Foods (Japan), Nestlé (Switzerland), FrieslandCampina (the Netherlands) and Danone (France)—provide complete, credible emissions estimates. However, under the current circumstances, even these four are not obligated to reduce these emissions. Most of the companies that do report emissions have seriously underreported them and have not included most of their supply chain emissions in their calculations.
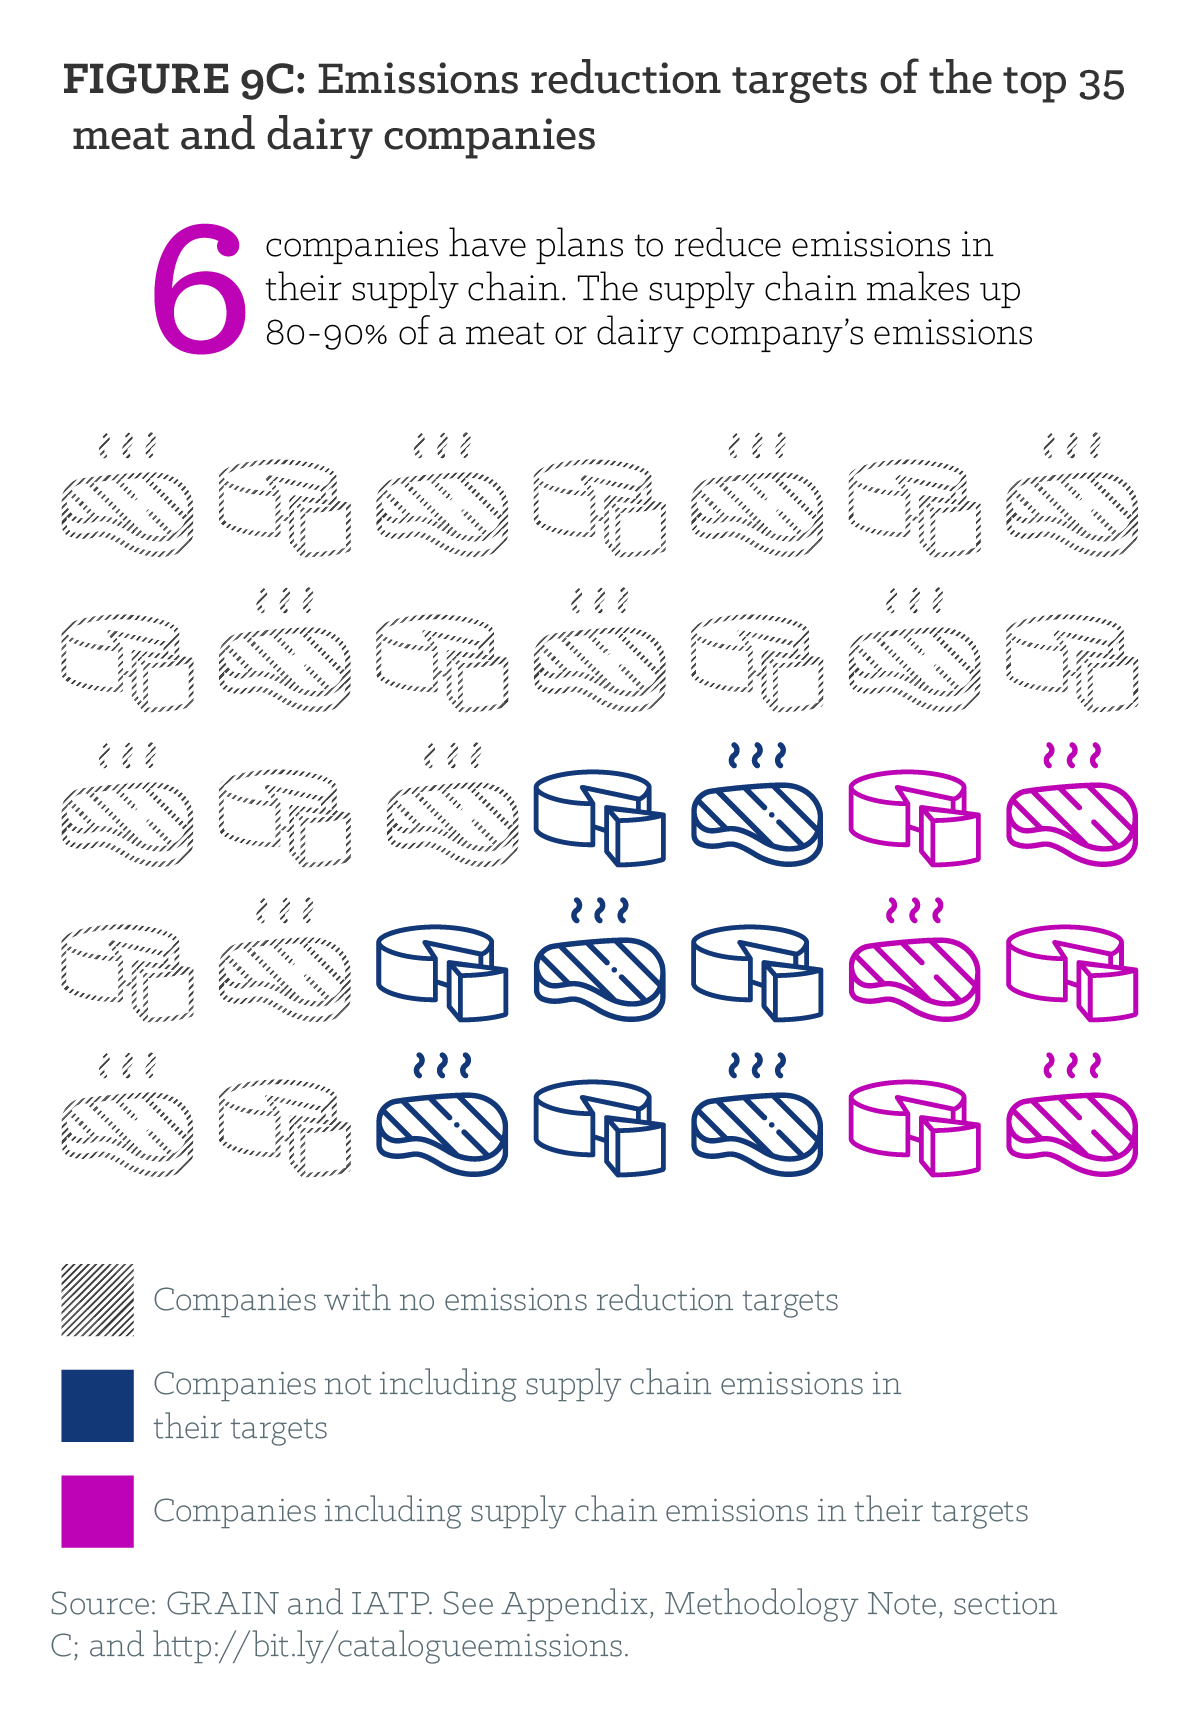
These supply chain emissions, covering everything from the production of animal feed crops to the methane released by cattle, generally account for 80–90 percent of meat and dairy emissions.12 However, large meat and dairy companies have a particular responsibility to include these upstream emissions in their accounting. As vertically integrated businesses, they exercise significant and often direct control over their supply chains, including feedlot and processing operations, contract farming systems and feed production units. It is thus critical that big meat and dairy companies be held directly accountable for the upstream supply chain emissions, and denied the ability to shift blame (and costs) onto their farmer suppliers or the public.
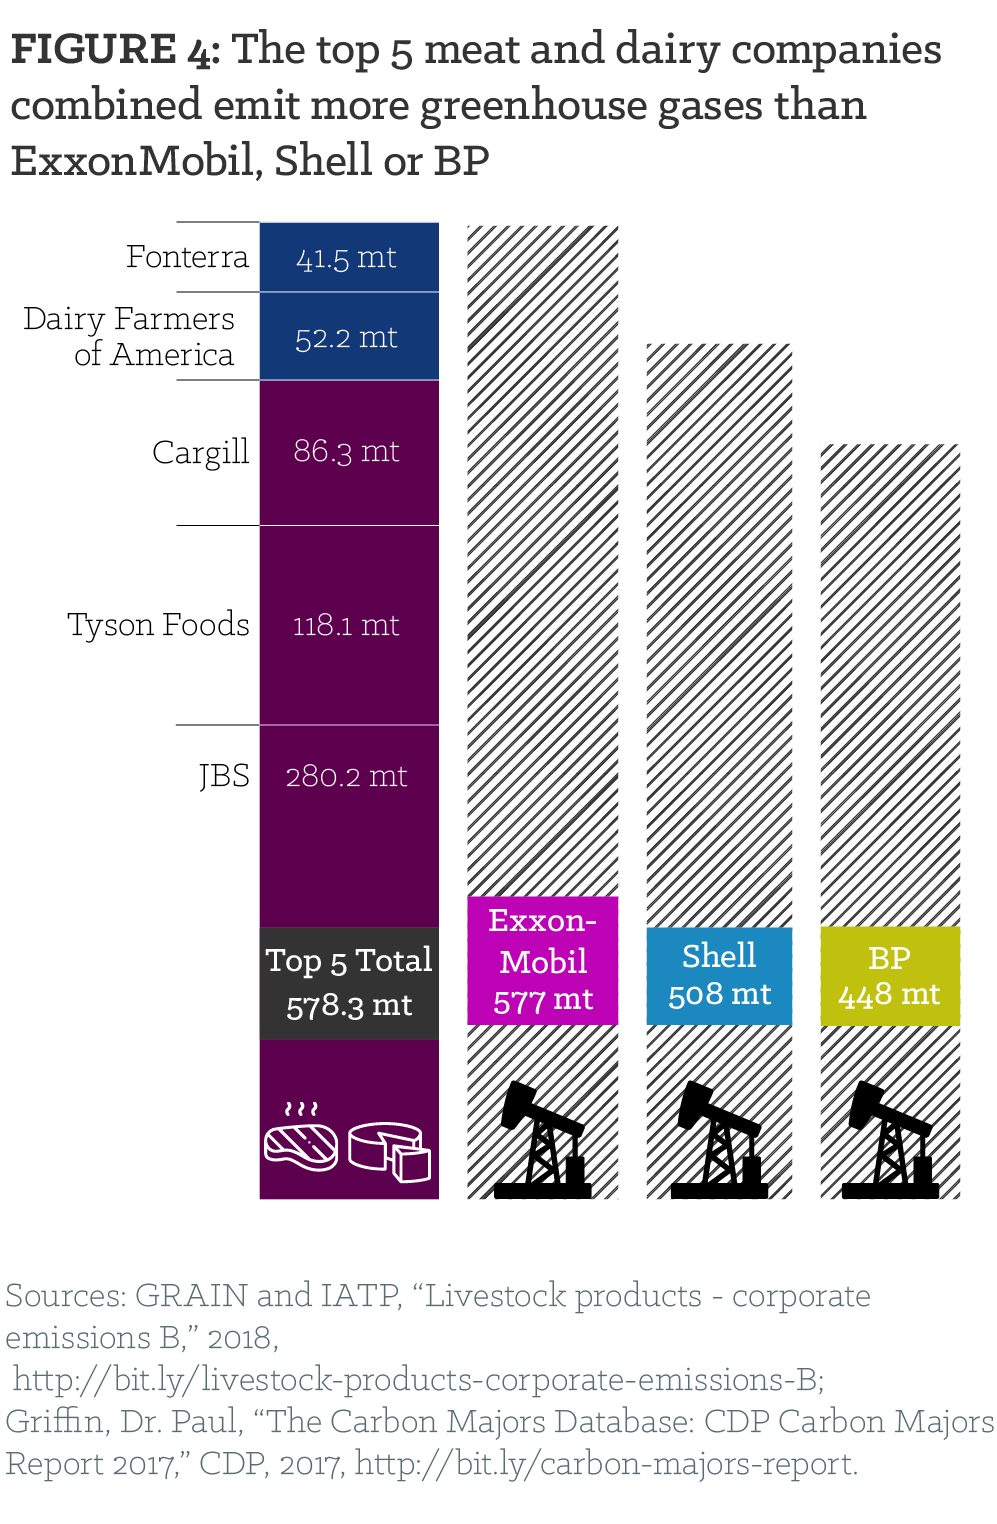
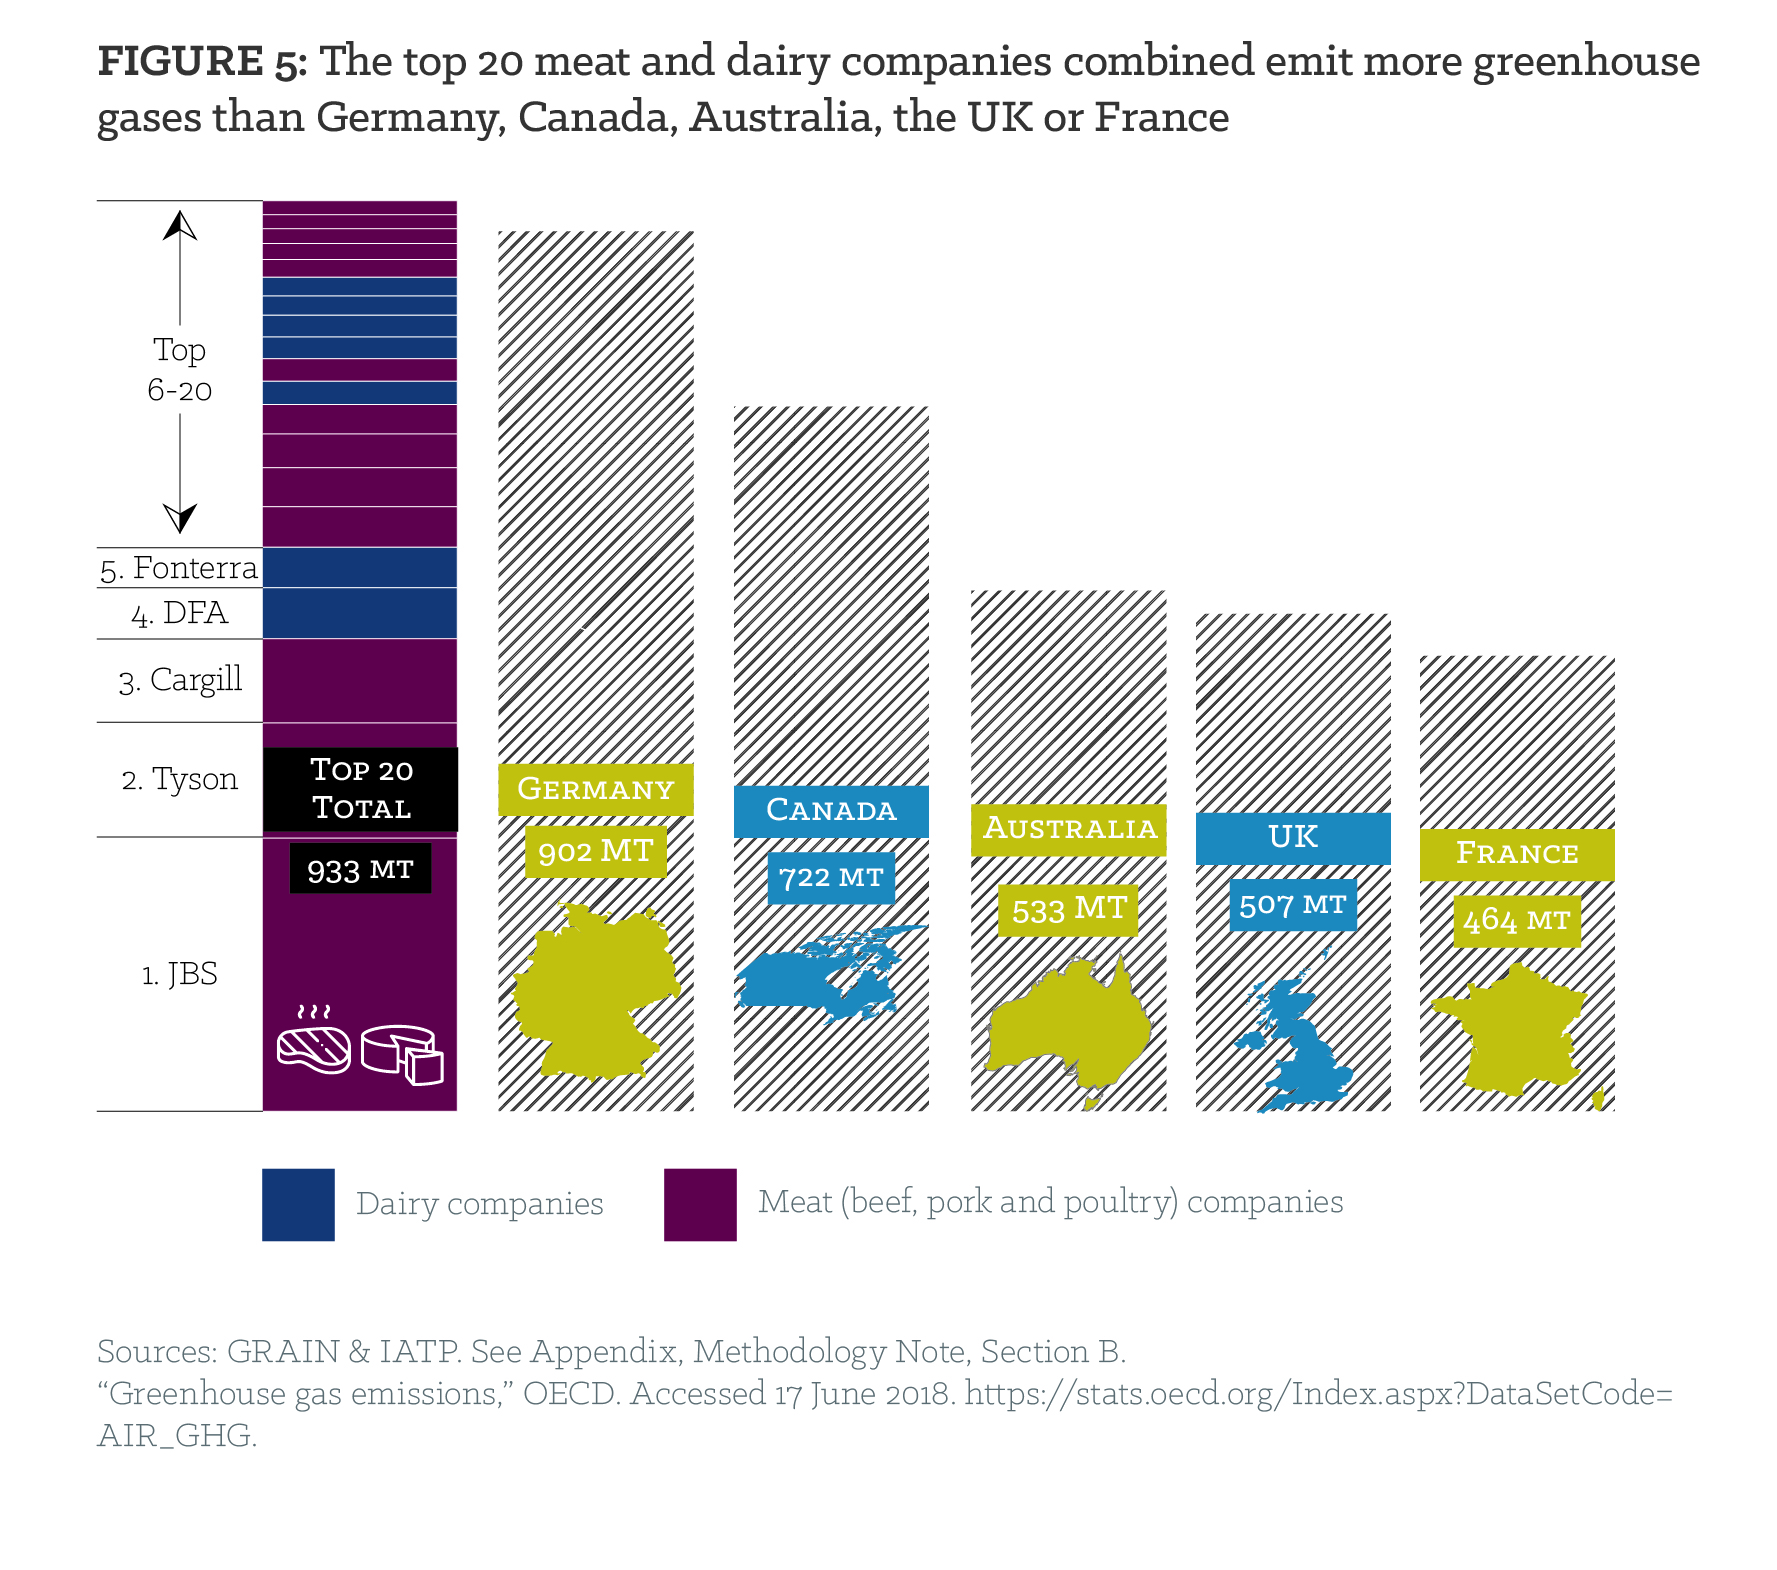
In the absence of comprehensive, transparent data from the largest companies, GRAIN and IATP made approximate calculations of the emissions from the meat and dairy divisions of these companies. We used a new emissions calculation methodology and regional data on emissions from livestock production developed by the FAO called the Global Livestock Environmental Assessment Model (GLEAM), combined with publicly available corporate data on production volumes (see appendix). The numbers are shocking: the combined emissions of the top five companies are on par with those of ExxonMobil and significantly higher than those of Shell or BP (Figure 4). Taken together, the top 20 meat and dairy industry emitters produce more emissions than many OECD countries (Figure 5).
Do some countries and regions matter more than others?
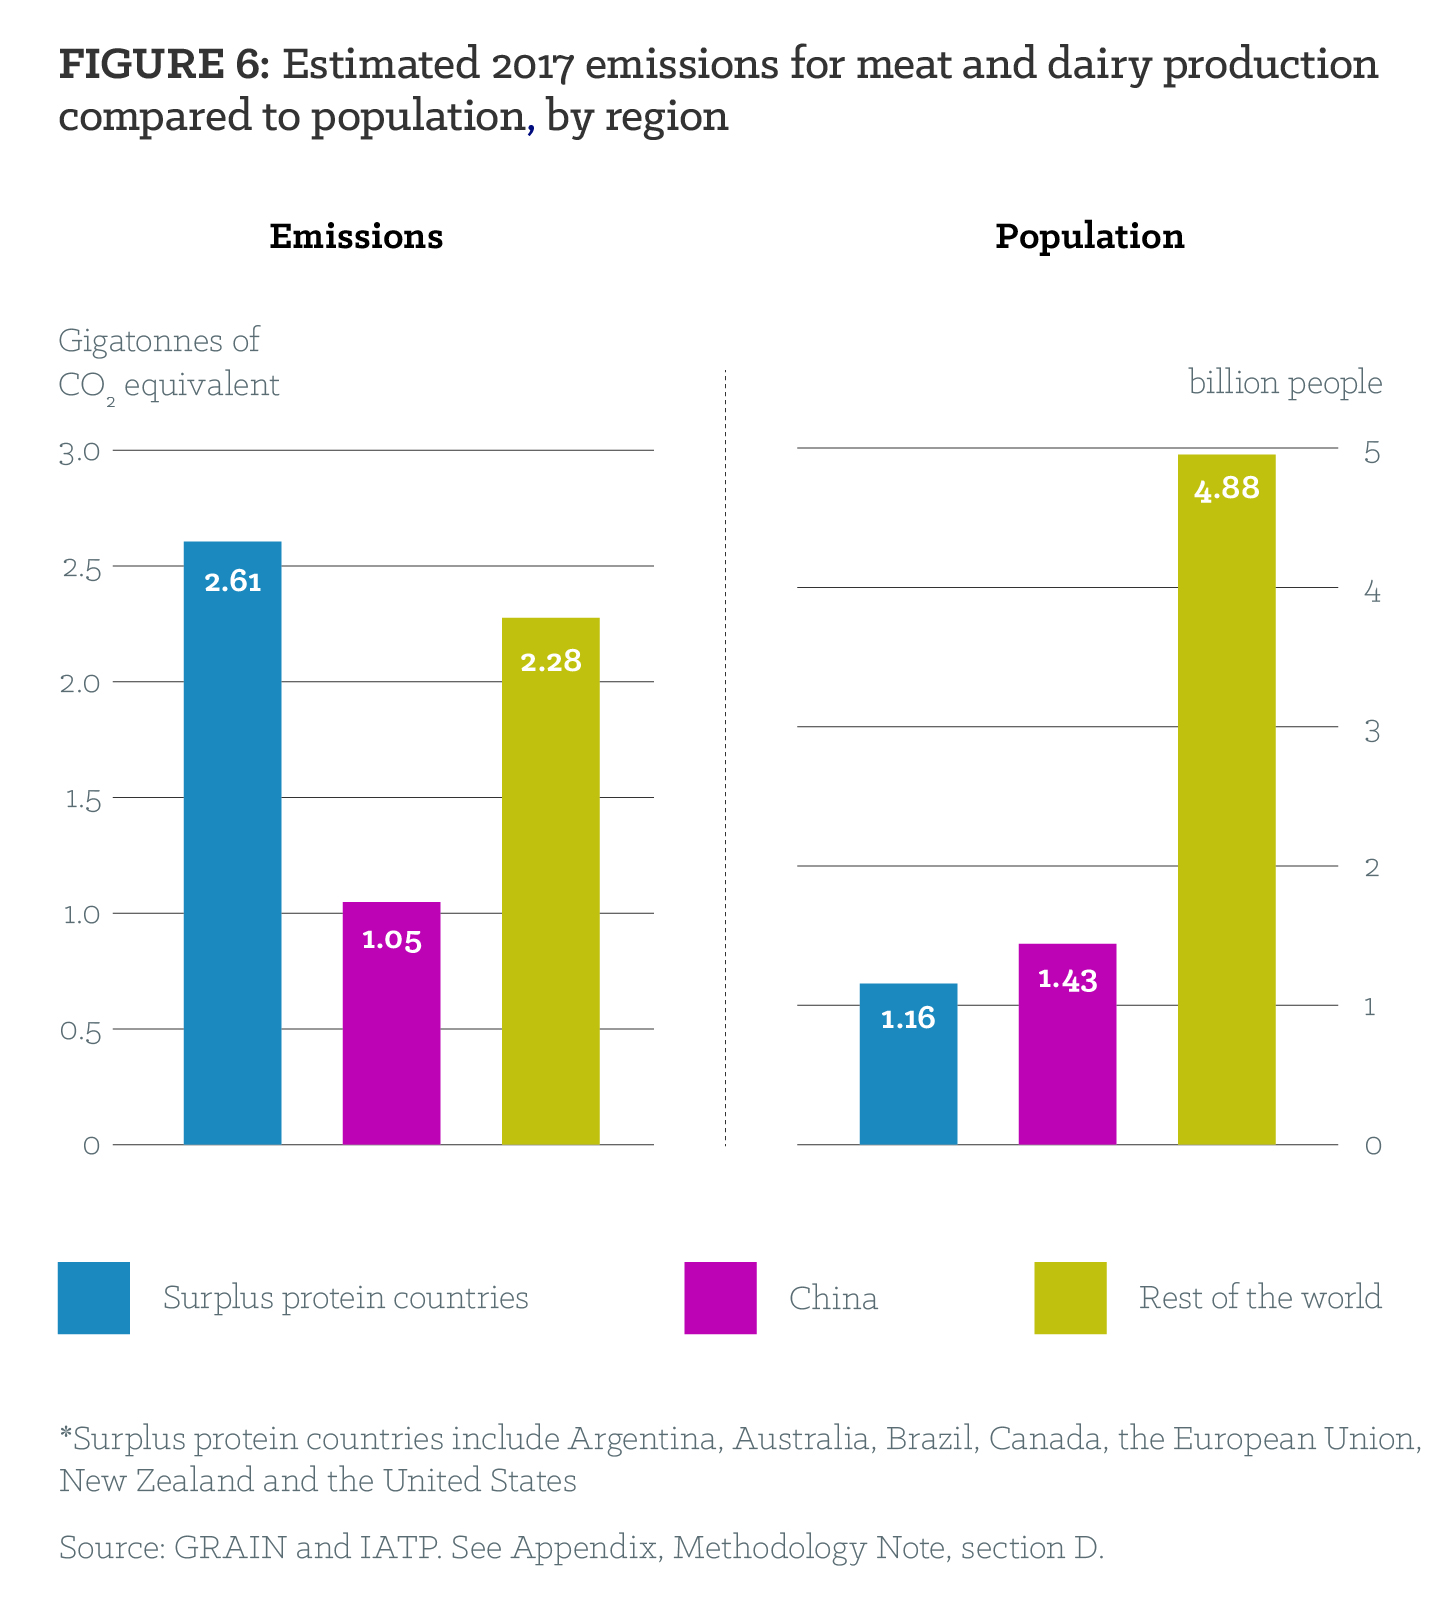
The full significance of these companies’ GHG footprint can be understood only when we consider where these emissions are produced. Geographically speaking, most meat and dairy emissions come from a small number of countries or regions with large land masses. The main culprits are the major meat and dairy exporting regions: the United States (U.S.) and Canada; the European Union (EU); Brazil and Argentina; and Australia and New Zealand. These regions, which JBS calls the “surplus protein” regions, have surplus production and high per capita consumption of meat and dairy. These countries account for 43 percent of total global emissions from meat and dairy production, even though they are home to only 15 percent of the world’s population (Figure 6).13 These are also the countries where most of the top meat and dairy companies have their operations (see Box 2).
Another key country is China, now the number one emitter of GHGs from meat and dairy production after two decades of exponential growth in per capita consumption, coupled with imports from the surplus protein countries and concentration of domestic production in the hands of a few large corporations. India is another important country in terms of emissions from its rapidly growing dairy sector. But its overall per capita emissions for meat and dairy production remain relatively small compared to the surplus protein countries; moreover, the picture is complicated by the multiple functions fulfilled by cows and buffalo for Indian families.
To illustrate the centrality of the surplus protein regions and China, the United States Department of Agriculture’s (USDA) Production, Supply and Distribution Database provides some startling 2017 figures.14 Just six countries or supranational entities (the U.S., the EU, Brazil, Argentina, Australia and China) account for nearly 68 percent of global beef production. Minus China, the five are still responsible for over 55% of world production, with the U.S. producing the largest quantity. Just three countries (Brazil, Australia and the U.S.) account for nearly half (46.5 percent) of global exports—adding India’s buffalo meat exports brings the total to 65 percent of global exports.
For pork, the concentration is much greater, with China, the EU and the U.S. producing 80 percent of the world total. The EU, the U.S., Canada and Brazil are responsible for over 90 percent of world exports, with the U.S. and the EU accounting for nearly two—thirds. Meanwhile, only four countries—the U.S., China, Japan and Mexico—account for nearly 60 percent of world pork imports.15
A similar situation exists for industrial poultry, with the U.S., Brazil, the EU and China accounting for 61 percent of global chicken production.16 Brazil and the U.S. alone account for 63 percent of world exports; if the EU and Thailand are added, the four sources account for 81 percent of world exports.
Dairy is no less concentrated. The EU, the U.S. and New Zealand account for nearly half (46 percent) of all global dairy production.17 If China is added, the share of world production rises to 52 percent. Where exports are concerned, the EU, the U.S. and New Zealand account for nearly 80 percent of skim milk powder exports while New Zealand alone produces 68 percent of whole milk powder exports.
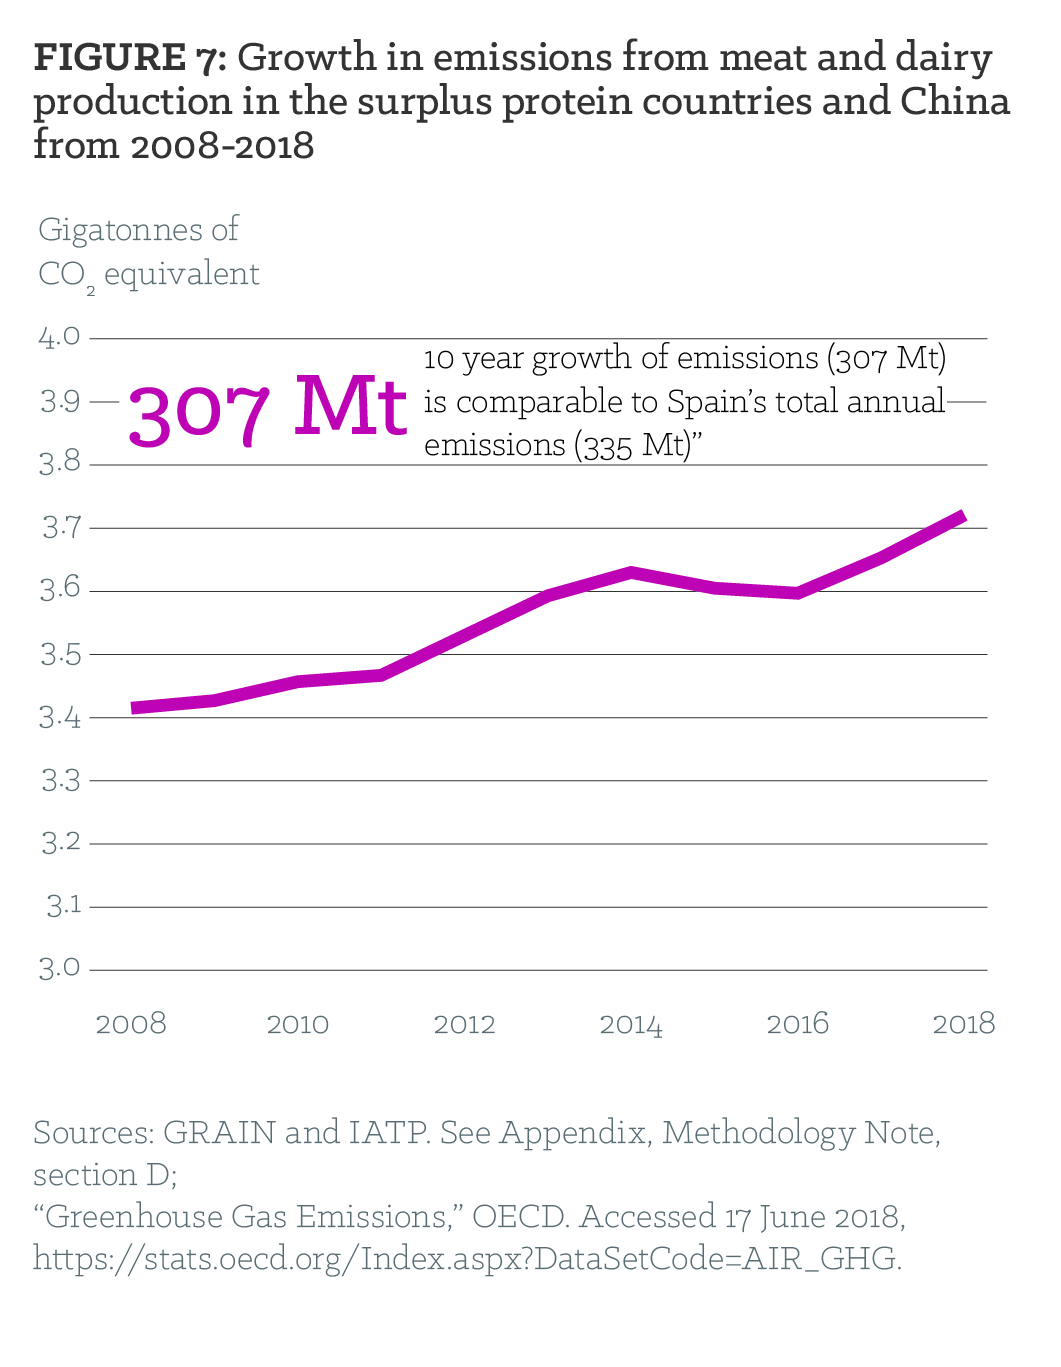
Considering all these statistics, it should come as no surprise that the “surplus protein” bloc plus China account for nearly two—thirds of global emissions from meat and dairy production.18 And emissions from these countries are increasing (Figure 7). If there is to be any chance of limiting the rise in global temperatures to 1.5°C, significant cuts in emissions from meat and dairy production in these countries must be prioritised.
Corporate concentration in the surplus protein bloc
The concentration of global meat and dairy production and exports in the handful of countries comprising the surplus protein bloc (plus China) is compounded by the concentration of production and exports in the hands of a small number of corporate actors. In the U.S., just four companies process 75 percent of the beef, 71 percent of the pork and over half of the chicken.19 In Brazil, three companies process one—third of the country’s massive beef output and just one company, BRF, processes one—third of the country’s chicken.20 In Australia, two companies (JBS Australia and Teys Australia) dominate beef processing, followed by NH Foods and others, with the five largest accounting for 57 percent of processing.21 And just 15 companies dominated the EU 27’s meat sector in 2010, with corporate concentration much more pronounced at the national level. For example, Germany produced nearly one—quarter of the pork from the EU 28 countries in 2017.22 Yet just four companies (Tönnes, Vion, Westfleisch and Danish Crown) process 64 percent of Germany’s pork.23
Box 2: The share of meat and dairy production of the top 10 companies in their countries of operation
The top 10 companies from each sector whose emissions we examined control a growing percentage of global meat and dairy production. For 2016, we estimate that these companies controlled nearly one—quarter of all global meat and dairy production.27 The extent of their control over production is, however, much more pronounced in the surplus—producing countries, as this is where they have most of their operations.
The top 10 beef companies operate out of the major exporting centres of Argentina, Australia, Brazil, Canada, the EU, the U.S. and Uruguay, as well as Japan. These companies control 37 percent of the production in these countries.
The top 10 dairy companies have their major operations in the EU and just four countries: Australia, Canada, New Zealand and the U.S.28 Together, these companies account for 46 percent of dairy production in these countries.
The top 10 poultry companies have their main operations in Brazil, China, the EU, Mexico, Saudi Arabia, Thailand, and the U.S. They control 47 percent of these countries’ chicken production.
And the top 10 pork companies have their key operations in the exporting centres of Brazil, the EU, and the U.S., where they control about a third of the production. They also operate in China, by far the world’s largest pork producer. When China is added to the equation, the top 10 companies control 19 percent of the pork production in these countries.
In dairy, New Zealand’s staggering share of global whole milk powder exports is largely in the hands of Fonterra, which controlled 84 percent of the country’s raw milk intake in 2015–2016.24 Second—tier (mainly Chinese—owned) companies such as A2 and Synlait are emerging as other dominant corporate actors in New Zealand.25 Forty percent of China’s booming dairy market is now controlled by two companies, Yili and Mengniu.26
No accountability, few targets, even fewer details
Any scenario that brings global meat and dairy production and emissions in line with a 1.5 °C pathway requires significant cuts in emissions by the surplus protein countries’ largest meat and dairy companies. Despite this imperative, there is no comprehensive reporting system across the sector, nor have many companies pledged to reduce net emissions.
Of the top 35 meat and dairy companies, 14 have announced some form of emission reduction targets. But of these 14, just six have comprehensive targets covering the full range of emissions associated with livestock production. The remaining eight companies specify reduction targets that appear to be limited to emissions produced only by their direct operations, such as offices, processing plants, company vehicles or other business activities, as opposed to animal and feed production. Excluding emissions from animal raising and feed production can underrepresent the overall emissions of meat and dairy processing companies by over 80 percent.29
Of the six companies that do include supply chains emissions in their targets, only two have made robust commitments to reduce their absolute emissions. Switzerland—based Nestlé, the world’s largest food company, has committed to reducing absolute emissions by 50% by 2050. Danone, the world’s second largest dairy company in terms of revenue, appears to have gone the furthest in reporting emissions and setting targets. It alone among the top 35 has committed to “zero net emissions” by 2050 (a target consistent with the one laid out in the Paris climate agreement). These reductions extend to its reported supply chain emissions from dairy. Danone’s supply chain emission calculations appear to be roughly consistent with GRAIN and IATP calculations.
But a glaring problem remains: Nestlé and Danone’s commitments are voluntary. Without legal regulations backed by strong sanctions, and absent independent systems of monitoring and verification, little can be done to hold these companies to their word.
And there are other accountability problems, starting with Danone’s action plan. If Danone were to take direct responsibility for zero net emissions by 2050, it would have to begin with a business plan that included cutting its output. But Danone plans to increase production. Rather than taking direct action itself, Danone’s plan apparently assigns the financial burden and investment risks associated with the needed reductions to its farmer suppliers. These farmers will be expected to reduce their emissions per litre of milk, thus reducing emissions intensity, while their absolute emissions will increase if they continue to produce more milk from more animals. Danone’s only other commitment to reaching net zero emissions appears to be an allotment for questionable offset programmes (more on Danone in Box 3).
No Specifics
Other companies in the meat and dairy sector also have flawed plans. For example, New Zealand based Fonterra, the world’s largest dairy exporter, plans to increase its production by a spectacular 40 percent in ten years (2015–2025).33 The company claims that it will make this growth “carbon neutral” through reductions in on—farm “emissions intensity,” without providing specifics on how such reductions will occur. Similarly, U.S.—based Smithfield Foods, the leading U.S. pork producer and exporter, and a subsidiary of the world’s largest pork company, WH Group, has pledged to reduce absolute GHG emissions from its U.S.—based operations by 25 percent by 2025 (compared to a 2010 baseline), offering few details about how it intends to achieve this reduction.
Based on a careful review of Smithfield’s public documents, the company appears to be reporting on its full range of emissions from its U.S. products. However, by limiting its emissions reduction pledge to the U.S., the company is excluding a significant part of its emissions generated by its parent company, Chinese—owned WH Group. WH Group’s Chinese operations generated 43 percent of the conglomerate’s profits in 2017.34 In addition, Smithfield’s reporting excludes emissions from large operations in Poland, Romania and Mexico.
Box 3: Danone
Danone’s proposed climate emissions trajectory from 2015–2050 would see the company increase its output (as implied in the upward—trending “do nothing” line in Figure 10). If this line is an indication, Danone’s production would increase by as much as 70 percent between 2015 and 2030, with similar growth likely between 2030 and 2050. So how can Danone possibly achieve net zero emissions?
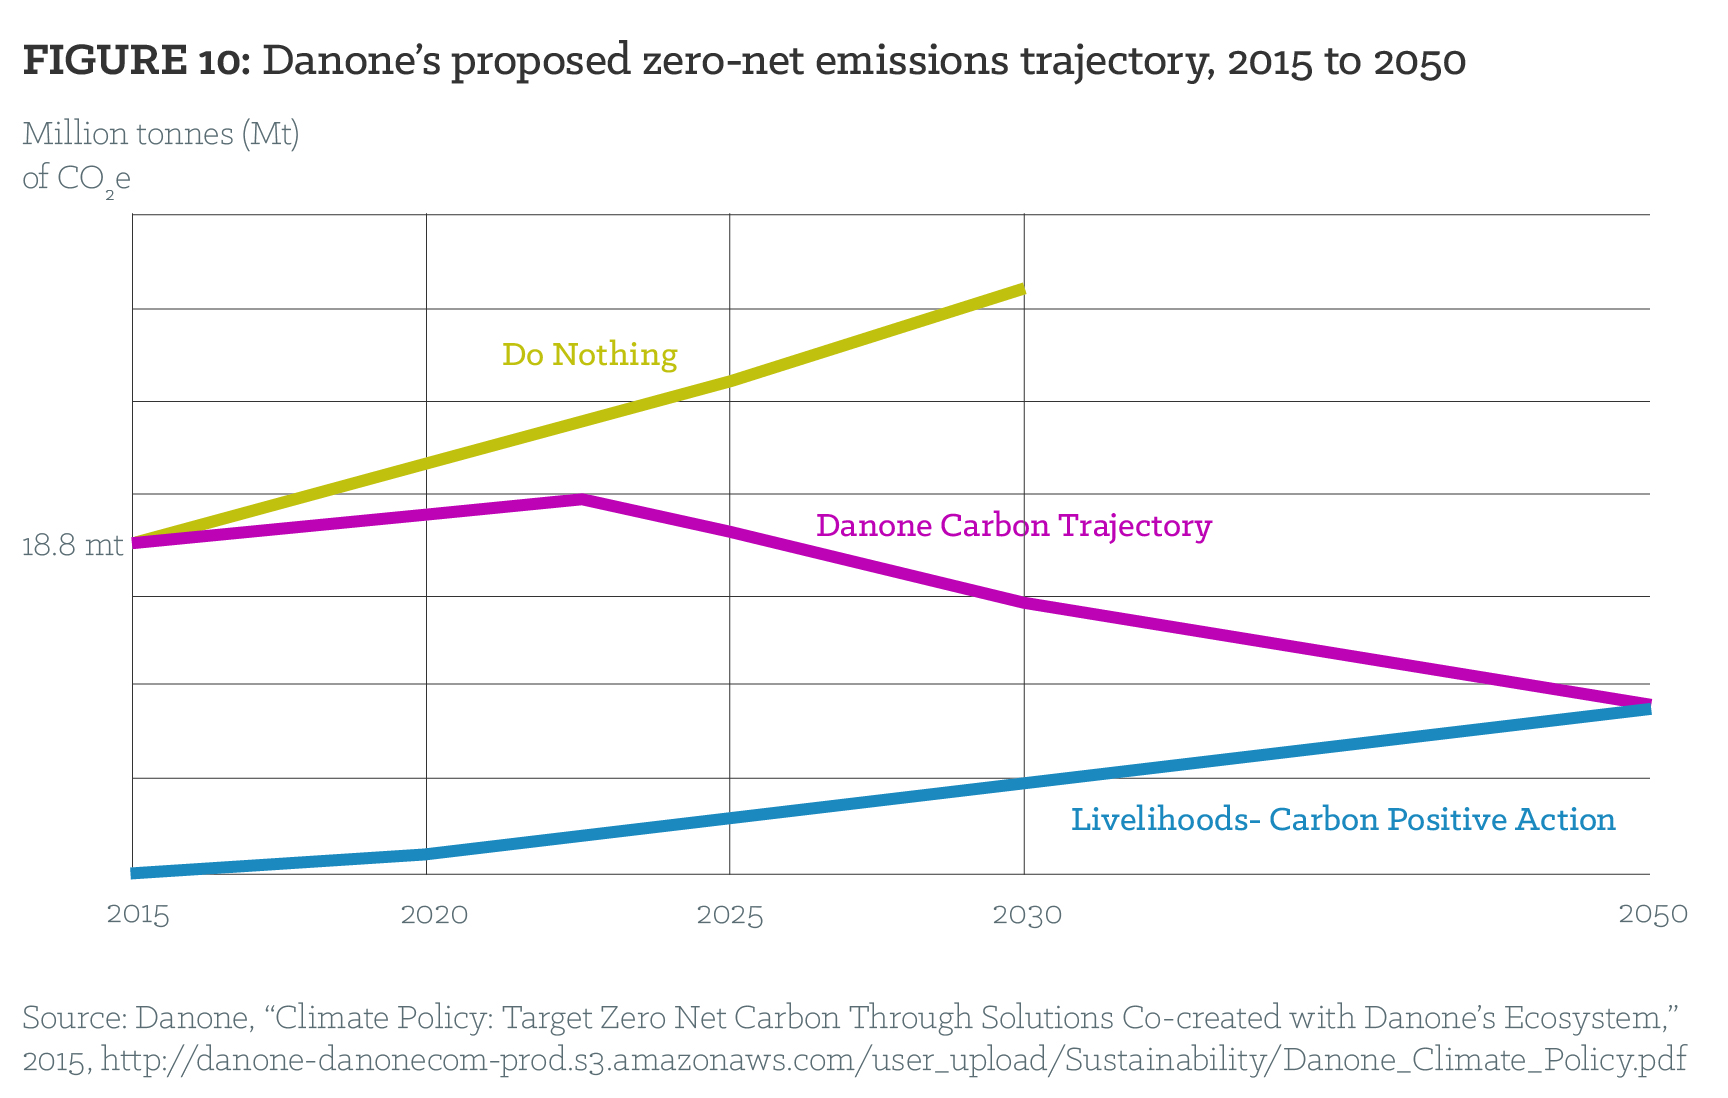
Part of Danone’s plan is to counterbalance its dramatic increase in output with an extraordinary reduction in emissions intensity (i.e., emissions per kilogram of milk) by its dairy farmer suppliers. The company’s commitment for 2030 would require its farmer suppliers to achieve intensity reductions in the neighbourhood of 30, 40, or 50 percent (depending on Danone’s product mix) in just over a decade. The available science suggests that such large intensity reductions in Danone’s milk supply chain will be difficult to achieve in the next 15 years.30
But even if this large reduction in emissions intensity was somehow realised, it would only cut the company’s absolute emissions in half with respect to 2015. To meet its target, Danone’s plan calls for offsets through a separate “Livelihoods” programme that proposes to sequester carbon by planting trees and converting small farms in the Global South to “sustainable agriculture practices.”31 Such offsets cannot be equated with reductions in Danone’s emissions. Practical experience with the type of offsets Danone proposes, as deployed in other corporations’ mitigation strategies, demonstrates that they are highly problematic.32
Substantial underreporting and non—reporting
Not only are the three largest conglomerates in the industrial meat and dairy sector—JBS, Tyson and Cargill—the largest global emitters, but they also have the weakest targets, or no targets at all. JBS, the world’s largest livestock processor, has no publicly stated medium— or long—term company—wide emission reduction targets. Although JBS claims to report on Scope 1, 2 and 3 emissions, its total reported emissions are approximately three percent of those calculated by GRAIN and IATP, which are based on the company’s annual production volumes (Figure 9B). Either the company has excluded most of its supply chain emissions from its calculations, or its publicly reported emissions data is inaccurate. U.S.—based Tyson announced in 2018 that it would reduce its GHG emissions by 30% between 2015 and 2030. Tyson does not report on its supply chain emissions, nor does its reduction target include them.35 Finally, Cargill, the largest private company in the U.S. and the second largest meat processor worldwide, appears to be following a model similar to Tyson’s: it too fails to report on supply chain emissions or include them in reduction targets. Cargill’s exclusion of these emissions from reduction targets is particularly noteworthy given the company’s own admission that they “account for roughly 90 percent of emissions across [its] value chain.”36

Growth at all costs
The only common element in this jumble of corporate promises and inaction on climate change is a commitment to growth. Tyson expects annual growth of 3–4 percent from beef and poultry sales, while Marfrig targeted 7.5–9.5 percent annual growth for 2015–2018.37 This target was set prior to the company’s acquisition of U.S.—based National Beef, making it the second largest beef processor in the world.38 Danish dairy giant Arla plans to add 2 billion kg of milk to its European supply chain between 2015–2020—a 14 percent increase.39 As already mentioned, Fonterra projects a stunning 40 percent increase in its processed milk volume for 2015–2025.
Many meat and dairy companies expect to derive much of their growth from exports. Jim Lochner, chief operating officer of Tyson Foods, explains the corporations’ logic as follows: “The old paradigm was that profitability and production are driven by domestic demand. The new paradigm is that they’re largely driven by grain costs and exports.”40
To ensure continued export growth, the companies turn to governments to knock down anything seen as a trade barrier, particularly through the negotiation of trade agreements. As trade deals have opened up new markets, exports have become a greater percentage of total production from countries where the top companies dominate, for example with pork in the U.S.
The EU is no exception. At a time when the EU should be grappling with tough choices on how to reduce its consumption and production of industrial meat and dairy, and supporting the livelihoods of European farmers, it is instead negotiating numerous trade agreements to boost EU exports. This includes the 2017 agreement with Japan, which slashed Japanese duties on meat and dairy imports from the EU. “This agreement is positive for Danish Crown in every way,” CEO Jais Valeur gushed, as he expects to see major increases in pork exports from the deal.41
The 2010 EU—Korea agreement translated into a sevenfold increase in cheese exports to the Asian nation. The same holds for U.S. beef exports to Korea, which have also increased sevenfold since the two countries signed their deal in 2007.42 In each instance, these agreements benefit large companies and large—scale farm operations, putting additional pressure on small farms to either become much larger or leave agriculture. Consider the example of the Canadian pork sector, which was dramatically transformed by the signing of the Canada—U.S. Free Trade Agreement in 1989, the North American Free Trade Agreement (NAFTA) in 1994 and the Marrakesh Agreement (which created the World Trade Organization or WTO) in 1995. In the decade after 1999, nearly half of the 30,000 Canadian farms producing pigs disappeared.43 U.S. agricultural census data shows a similar trend: in 1992, just 30% of pigs were raised on farms with over 2000 animals.44 By 2004, 80 percent of all pigs were raised on such large farms. Today, that figure has risen to 97 percent.45
These deals cut both ways: the EU’s trade agreement with South America’s Mercosur countries (Brazil, Argentina, Paraguay and Uruguay) is unlikely to happen unless Europe opens its market to South American beef.46 Brussels has reportedly agreed to an influx of 99,000 tonnes per year, on top of the 230,000 tonnes it already imports from the region.47 The Canada—EU trade deal, now undergoing ratification, affords Cargill and JBS—both dominant players in Canadian beef and pork processing—greater access to the EU’s beef and pork market, as well as a commitment to eliminate further regulatory barriers to doing business; the result will be to pump additional quantities of meat into the EU.48
Neither the governments negotiating these deals nor the corporations operating within their jurisdictions have made any serious attempt to assess the evident contradiction between the ensuing growth in meat and dairy production and the actions necessary to avoid dangerous climate change. Instead, the companies and the governments continue to justify growth by invoking misleading and insufficient reductions in emissions intensity.
Emissions impossible
Emissions intensity targets count emissions per kilogram of meat or milk, but they do nothing to curtail overall growth in company emissions, sales, processing volumes, revenues, or profits. While intensity may be kept in check or even reduced, total emissions will continue to rise in tandem with production. It is easy to see why corporations focus on reducing intensity rather than reducing total emissions.
An emissions intensity approach also provides a justification for exports. If New Zealand is a lower—intensity producer of milk than China, the reasoning goes, then the climate will benefit by having China import from New Zealand rather than producing its own milk. This argument could be adduced to claim that Chinese trade barriers or national emissions reduction schemes unfairly penalise New Zealand dairy producers.49
The reality is that China has become a dumping ground for major dairy exporting nations and regions, including companies based in New Zealand, the U.S. and the EU, which are anxious to sell their excess production. The glut of cheap powdered milk, whey and other dairy products available on the international market has, with the blessing of the Chinese government, turned into a wave of processed dairy foods that is flooding the Chinese market and displacing traditional non—dairy foods, many rich in calcium. Two of the fastest—growing dairy products in China are infant formula and mozzarella cheese for pizzas.50 Driven by cheap imports, China’s demand for dairy is projected to grow by 27 percent and its imports by 50 percent between 2016 and 2026.51
Arguments for emissions intensity reduction in the absence of targets to reduce the livestock sector’s total emissions are dangerous, because reducing emissions per unit of food is simply inadequate. Over the past century, farmers and corporations have reduced the emissions intensity of livestock production and processing, but these gains have been overwhelmed by increases in absolute emissions as a result of the doubling, and then the quadrupling, of production and consumption. We are emitting less per kilogram, but overall, we are emitting more GHGs because we are producing and consuming many, many more total kilograms.
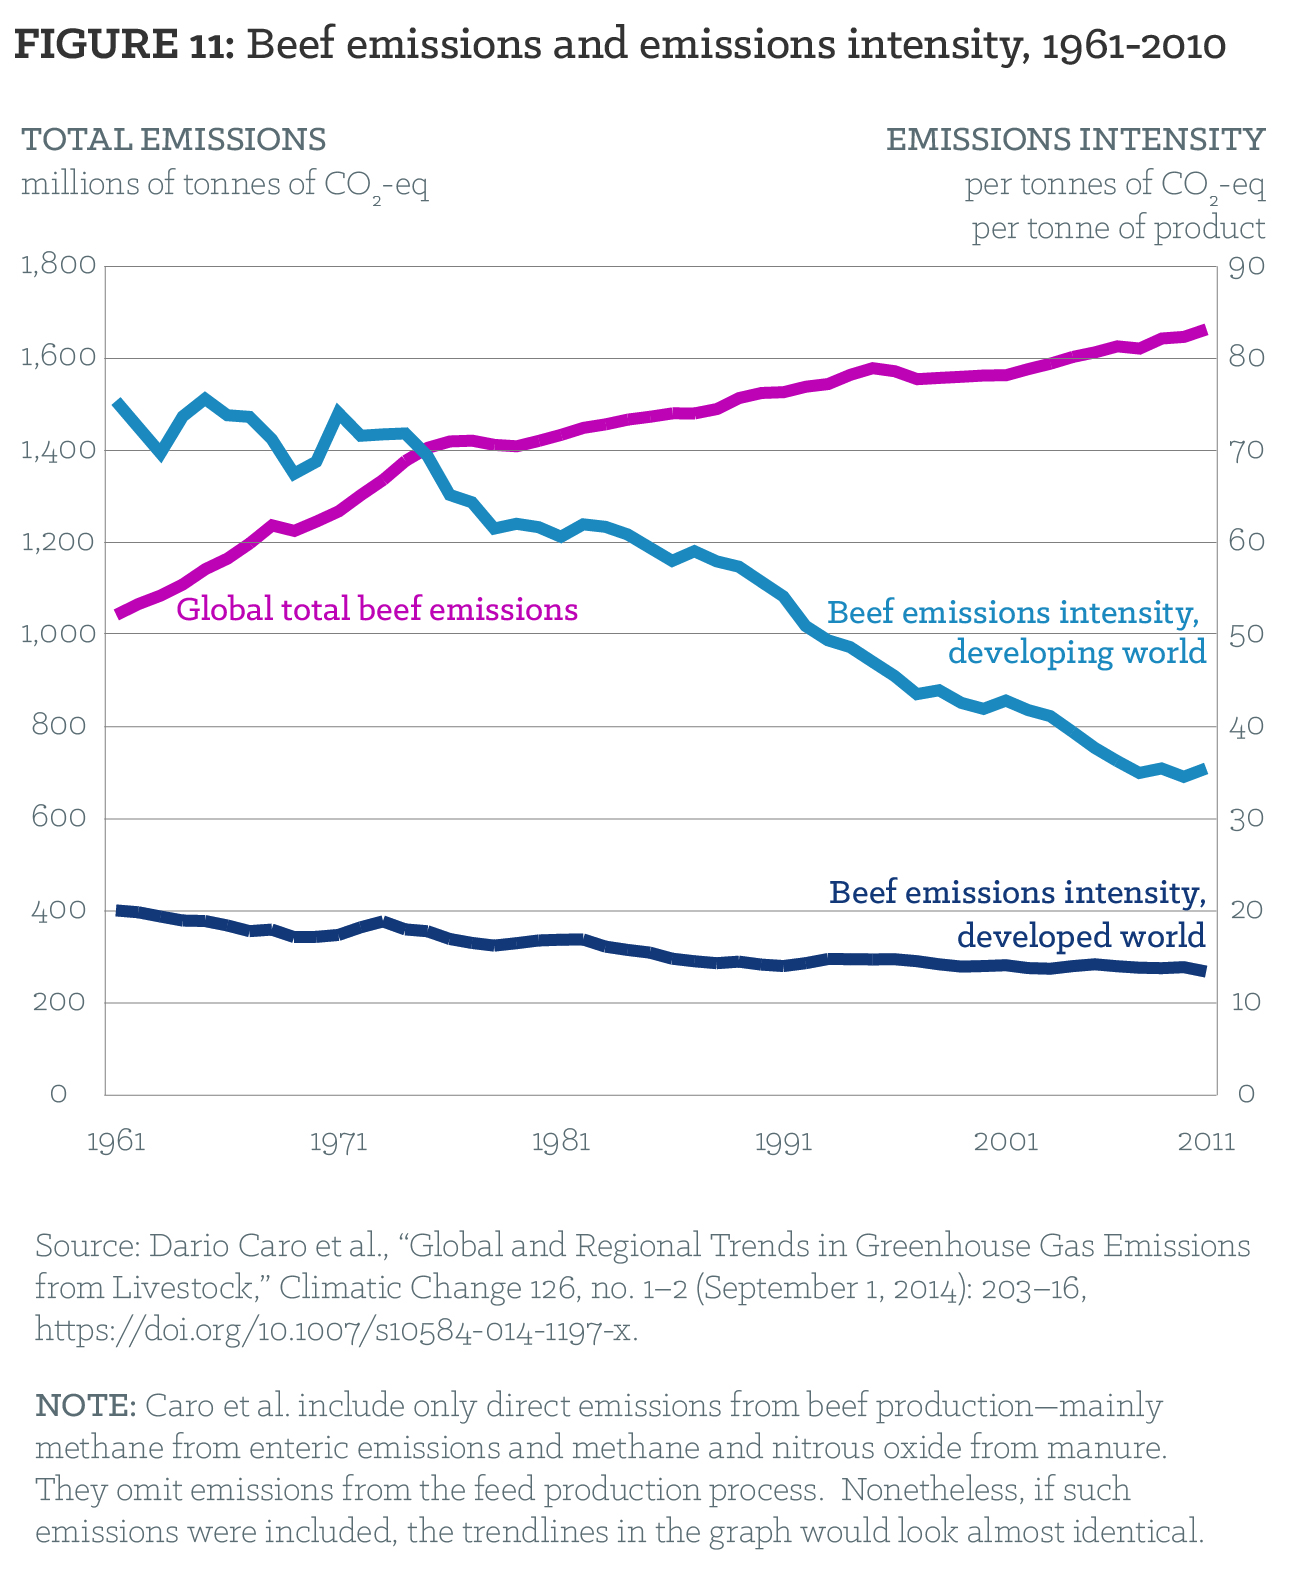
Consider the case of chicken. In 2010, the global average GHG emissions per kilogram of chicken were one—third to one—half what they were in 1961.65 But the total GHG emissions from chicken production in 2010 were nearly five times higher than in 1961.66 The reason? Overall chicken production was higher—nearly 11 times higher than in 1961, or five times higher on a per capita basis.67 As emissions intensity was falling, emissions were rising. Even taking population growth into account, the average person was simply eating much more meat than before.
The situation is similar with beef (Figure 11). This is the problem with emissions intensity targets. Over the medium and long term, they can coexist with significant increases in overall emissions. If emissions intensity reductions are to make a meaningful contribution to addressing climate change, they must be part of a limit on absolute emissions and not the sole solution.
Over the coming years, this contradiction between the corporate imperative to grow (and hence focus on emissions intensity) versus our ecological and social urgency to reduce absolute emissions will become starker. The most important consideration is that the large gains in “efficiency” realised by industrial farming in the twentieth century will be hard to repeat without major ecological, social and health impacts.68 While there are efforts underway to identify farm management practices and new technologies, such as vaccines or feed additives, that might reduce emissions intensity on industrial farms supplying the big meat and dairy companies, the science, economics and scalability of these options are far from certain.69 The expectations of a 30, 40 or even 50 percent near—term reduction in emissions intensity, on which some meat and dairy companies have staked their emission reduction targets, should be regarded with a healthy dose of scepticism.70
Box 4: Corporate influence on climate and agriculture policy
It is hard to overstate the omnipresence of big meat and dairy executives in government policy circles and their corresponding influence on agriculture and climate change policy. In the U.S., both of the top officials nominated by President Trump to deal with climate change—Sonny Perdue, as the Secretary of Agriculture, and Scott Pruitt, as the former head of the Environmental Protection Agency—are climate sceptics with close ties to the agribusiness lobby.52,53 Meanwhile, as an example of the revolving door between government and agribusiness, the Secretary of Agriculture under President Obama, Tom Vilsack, is now the CEO of the U.S. dairy export lobby.54
In Brazil, the Minister of Agriculture, Blairo Maggi, is one of the country’s largest producers of animal feed crops, with a personal business interest in expanding Brazil’s meat and dairy industry. Last year, he publicly warned the FAO not to recommend reductions in meat consumption because of climate change.55 Furthermore, the influence of JBS and its CEOs over the previous two governments and the current Temer government is now well—documented, along with the massive corruption that has resulted.56
The revolving doors and the entrenched capture of government policy in the key protein surplus exporting countries help explain why these governments, rather than leading the charge in reducing livestock—related emissions, have yet to take concrete action to reduce agribusiness emissions (despite often mentioning agriculture mitigation as part of their national climate plans).57 Where they have, as in the U.S. state of California, the rules of the game are rigged to further incentivise industrial dairies through climate funds.58
The industry’s political influence extends to the international arena, as can be seen from its involvement in the Global Research Alliance on Agricultural Greenhouse Gases (GRA), launched by New Zealand at the 2009 climate talks in Copenhagen in an attempt to influence outcomes on agriculture within the UN climate negotiations. The surplus protein bloc governments in the GRA are supporting scientific programmes narrowly focused on “emissions intensity” approaches that do not help curtail growth in livestock production. Other international initiatives, such as the Global Agenda on Sustainable Livestock (housed at the FAO), seek to build a global consensus around the sustainability of industrial livestock; their membership includes industry lobby groups such as the International Feed Industry Federation.59 One measure of the reach of these initiatives is the recognition accorded to the concept of “emissions intensity” in the last report of the Intergovernmental Panel on Climate Change.60
Meat and dairy lobby groups brought negative attention to bear on the FAO after the UN body was the first to publish findings on the global emissions of the meat and dairy industry in 2006.61 “You wouldn’t believe how much we were attacked,” said Dr. Samuel Jutzi, then the director of the FAO’s Animal Production and Health Division, describing the industry’s reaction to its findings.62 Jutzi said that powerful lobby groups subsequently blocked and derailed actions at his organisation with the support of a few governments.63 The FAO eventually brought the main meat and dairy company lobby groups into a partnership to reassess the FAO’s climate emissions data and analysis.64
What is more certain is that farmers—not the big companies they supply—will have to bear the considerable costs, paperwork and labour involved in implementing these practices and technologies. For the animals on these farms, which are already pushed to their biological limits, any efforts to make them more productive are likely to exacerbate the extensive animal health and welfare problems they already face.71
Box 5: Impacts of “efficiency” on animals, food production and land use72
In the past 40 years, milk production per cow has more than doubled.73 The European Food Safety Authority has concluded that “genetic selection for high milk yield is the major factor causing poor welfare, in particular health problems, in dairy cows.”74 After just three or four lactations, many cows are no longer able to produce sufficient milk and are prematurely slaughtered.
Genetic selection is widely used by the livestock industry to drive animals to faster growth and higher yields, with disastrous effects on animal health and welfare. Chickens have been bred to reach their slaughter weight about twice as quickly as 40 years ago, and their legs cannot keep pace with the rapid body growth. As a result, many chickens suffer from painful, sometimes crippling leg disorders.75,76 The high productivity of the modern laying hen causes osteoporosis, with a substantial risk of fractures. The hens can suffer from these fractures for several months while they are laying eggs, or more than 24 hours if the fracture occurs when they are removed from cages and transported to the slaughterhouse (depending on the length of the journey and the wait before slaughter).77
Further, the “efficiency” of intensive livestock production is a myth that is dependent on feeding human—edible cereals to animals who convert them very inefficiently into meat and milk. For every 100 calories fed to animals as cereals, just 17–30 calories enter the human food chain as meat.78,79 The conversion of grain protein into meat and milk is similarly poor.80 Experts describe the use of cereals to feed animals as “staggeringly inefficient”81 and “a very inefficient use of land to produce food.”82 The FAO warns that further use of cereals as animal feed could threaten food security by reducing the grain available for human consumption.83
So how do we get out of this?
There are several possible pathways to bringing emissions from meat and dairy production down to levels that are compatible with global efforts to prevent dangerous climate change. All of them, however, require significant reductions in meat and dairy production and consumption in the overproducing and overconsuming countries. Reduction in both production and consumption in the United States, the EU, Australia, New Zealand and Brazil alone would result in dramatic cuts in global emissions. Other countries must also take care to keep consumption and production at moderate per capita levels, in line with their nutritional requirements and the Paris Agreement goal of limiting global warming to 1.5 °C.
Current industrial levels of production cannot be sustained, nor can growth models for meat and dairy remain unchanged. The paradox of the corporate business model based on high rates of annual growth versus the urgent climate imperative to scale back meat and dairy production and consumption in affluent countries and populations is untenable.
For farmers, the growth of the big meat and dairy operators continues to be an unfolding disaster. In Europe and North America, the relatively few small and medium—sized producers who are not wiped out by agricultural policies that are biased in favour of agribusiness, often find themselves trapped in unfair supply arrangements dictated by these companies, with limited access to other buyers.84 In countries like Kenya, China, India or Brazil, small livestock producers are being pushed off their land to make space for the expansion of industrial farm operations; in many countries of sub—Saharan Africa, they simply can’t compete with the subsidised meat and dairy dumped on their markets.
Farmers can and should, if stable markets and decent prices are guaranteed, supply moderate quantities of meat and milk into local food systems. But they do not enjoy these conditions. And instead of having to bear the costs of intensifying their emissions to protect the growth agendas of the big meat and dairy companies, farmers can, with the support of public programmes, shift to agroecological practices and mixed farming systems that can lower the emissions and overall environmental footprints of their farms, as well as provide much better living conditions for animals.85
Nor are consumers benefiting from the corporate production of cheap meat and dairy. Overproduction and overconsumption of meat and dairy pose significant threats to public health, not only as major contributors to cancer, obesity, diabetes, high blood pressure and other health problems, but also because factory farms have become a leading source of antibiotic resistance and highly pathogenic diseases. Many consumers try to address these problems by making specific dietary choices. But this, on its own, is a limited solution. We must join forces to fix the food system so that it can supply everyone with moderate amounts of high—quality meat and dairy, in a way that respects people, animals and the planet.
Workers, too, need an exit from the repressive conditions of modern meat and dairy factories. The industry is among the most dangerous and least protective of workers, and attracts some of the most marginalised populations. Workers are required to slaughter and process hundreds of animals an hour, for measly wages and under difficult conditions.86 If we slow things down, reduce the scale, focus on quality and bring care and craft back into the trade, meat and dairy processing can once again afford good jobs and dignified work.
As this report has noted, cheap meat and dairy comes at a high cost due to social, environmental and animal welfare problems that continue to be under-regulated. In addition, this production is only made possible because the corporations receive an indirect subsidy from taxpayers in the form of government-funded price supports that keep grain cheap.87 It is past time to regulate the industry and redirect the massive subsidies and other public expenditures that currently support the big meat and dairy conglomerates towards local food and farming systems capable of looking after people and the planet.
We are not going to achieve these radical transformations of our food system without a fight with the big meat and dairy companies. These are powerful actors with deep political connections, working hand in hand with governments to protect their interests (see Box 4). Breaking their grip will require a big, collective movement of farmers, workers and consumers. This is a movement that has been building for some time but has struggled to overcome the political power of the corporations. Climate change brings a new urgency to our organising efforts.
Endnotes
- JBS, “JBS Day New York, 4Q13 and 2013 Results Presentation,” 25 March 2014. http://jbss.infoinvest.com.br/enu/2892/JBSDayNY_4Q13_eng.pdf
- JBS, “JBS Day Transcription — 2013 and 4Q13 results,” 25 March 2014. https://docslide.com.br/documents/jbs—day—transcription—2013—and—4q13—results.html
- For a good summary of peer reviewed literature linking increased livestock consumption to catastrophic climate change, see Kim, B., Neff, R., Santo, R., & Vigorito, J. “The importance of reducing animal product consumption and wasted food in mitigating catastrophic climate change,” Baltimore, MD: Johns Hopkins Center for a Livable Future, 2015. https://www.jhsph.edu/research/centers—and—institutes/johns—hopkins—center—for—a—livable—future/_pdf/research/clf_reports/2015—12—07e—role—of—diet—food—waste—in—cc—targets.pdf;
The growth numbers cited by JBS are based on data provided by the UN Food and Agriculture Organization for increases in production of beef, pork, poultry and ovine meat, which are also the basis for the emissions projections in Figure 1 of this report.
- Greenpeace International, “Less is more: Reducing meat and dairy for a healthier life and planet,” 2018. http://www.greenpeace.org/livestock_vision.
- FAO, “Livestock’s Long Shadow: Environmental Issues and Options”, 29 November 2006. http://www.fao.org/3/a—a0701e.pdf
- P.J. Gerber et al. “Tackling climate change through livestock – A global assessment of emissions and mitigation opportunities,” FAO, 2013. http://www.fao.org/3/a-i3437e.pdf
- “The Paris Agreement central aim is to strengthen the global response to the threat of climate change by keeping a global temperature rise this century well below 2 °C above pre—industrial levels and to pursue efforts to limit the temperature increase even further to 1.5 °C.” https://unfccc.int/process—and—meetings/the—paris—agreement/the—paris—agreement
- 1 gigaton = 1 billion tons.
- Here we are referring to a GHG emissions budget based on the cumulative amount of GHG emissions permitted over a period of time to keep average increases in global temperature within 1.5 °C.
- Based on livestock product company emissions that include emissions from livestock farming systems and fossil fuel company emissions that include downstream emissions.
- In terms of their volume of production.
- P.J. Gerber et al. “Tackling climate change through livestock – A global assessment of emissions and mitigation opportunities,” FAO, 2013. http://www.fao.org/3/a-i3437e.pdf
- This figure is based on production volumes of beef, pork, poultry (broiler meat) and milk for 2017. National and world production volumes are from USDA FAS. Emissions were calculated using the regional averages for emissions intensity determined by FAO GLEAM. The JBS reference is from “JBS Day Transcription — 2013 and 4Q13 results”: https://docslide.com.br/documents/jbs—day—transcription—2013—and—4q13—results.html
- Production, export and import data for beef, pork, poultry and dairy in this section is derived from USDA’s Production, Supply and Distribution Database (Top Countries by Commodity) for 2017, accessed at: https://apps.fas.usda.gov/psdonline/app/index.html#/app/topCountriesByCommodity
- Mexico is a high importer in part because the North American Free Trade Agreement has created an integrated North American pork production chain across the continent that requires animals or their parts to be traded and processed across the U.S. and Mexico.
- Where the data refers to “chicken,” it is for broiler meat production and excludes other poultry, such as turkey or layer hens.
- Total fluid milk production (which we use as a proxy for dairy production) from these countries totals 48.67% of world production. These figures are obtained from USDA FAS PS&D.
- Based on production volumes of beef, pork, poultry (broiler meat) and milk for 2017. National and world production volumes are from USDA FAS. Emissions were calculated using the regional averages for emissions intensity determined by FAO GLEAM.
- Philip Howard, “Corporate concentration in global meat processing: the role of government subsidies,” Working paper, Department of Community Sustainability, Michigan State University, September 2017, https://philhoward.net/2017/06/21/consolidation-in-global-meat-processing/
- Calculations by GRAIN/IATP based on USDA country data and carcass weight equivalent volumes for beef determined by company—reported slaughter volumes and FAO carcass weight conversion factors. For chicken, volume is based on weight of slaughtered chicken. We used company reports to estimate that 86% of JBS’ reported Latin American beef production is in Brazil; 80% for Marfrig; and 80% for Minerva.
- Australian Competition and Consumer Commission, “Cattle and Beef Market Study—Final Report, p. 29, March 2017. www.accc.au.gov
- European Commission “Meat Market Observatory—Pig,” 17 May 2018, accessed at: https://ec.europa.eu/agriculture/sites/agriculture/files/market-observatory/meat/pigmeat/doc/slaughterings-eu_en.pdf Total EU28. Pork production (in 1000 tonnes, slaughter) totalled 23,311, of which Germany produced 5,455.
- ISN — Interessengemeinschaft der Schweinehalter Deutschlands e.V., “Marktanteile der deutschen Schweineschlachtbetriebe 2017”, April 2018, accessed at: https://www.agrarheute.com/media/2018—04/tabellen_und_grafiken_zum_isn_schlachthofranking_2017.pdf
- Coriolis et al., “The Investor’s Guide to New Zealand’s Dairy Industry 2017,” June 2017. http://www.mbie.govt.nz/info—services/sectors—industries/food—beverage/documents—image—library/folder—2017—investors—guides/investors—guide—to—the—new—zealand—diary—industry—2017.pdf
- Ibid.
- USDA—ERS, “China Dairy Supply and Demand,”
p. 7, December 2017. https://www.ers.usda.gov/webdocs/publications/86231/ldpm-282-01.pdf?v=43084
- Based on company—reported production volumes compiled by GRAIN/IATP and world production data from USDA FAS.
- Based on company reports, we estimate that only 6% of total dairy production by the top 10 companies occurs outside of Australia, Canada, the EU, New Zealand and the U.S.
- P.J. Gerber et al. “Tackling climate change through livestock – A global assessment of emissions and mitigation opportunities,” FAO, 2013: http://www.fao.org/3/a-i3437e.pdf
- Danone sources most of its milk from farms where dairy cattle are already moderately productive (approx. 4,000 kg of milk per cow per year). Further opportunities for emissions intensity reductions are limited once cows are moderately productive.
See Gerber, Pierre, Theun Vellinga, Carolyn Opio, and Henning Steinfeld, “Productivity Gains and Greenhouse Gas Emissions Intensity in Dairy Systems.” Livestock Science 139, nos. 1–2, July 2011. This study concludes that top—level emissions reductions in European dairy are in the range of 14–26%.
See S.J. Gerssen—Gondelach et al., “Intensification pathways for beef and dairy cattle production systems: Impacts on GHG emissions, land occupation and land use change.” Agriculture, Ecosystems & Environment, vol. 240. http://dx.doi.org/10.1016/j.agee.2017.02.012.
The limitations of mitigation strategies in the Netherlands are assessed in Theun Velling et al, “Effectiveness of climate change mitigation options considering the amount of meat produced in dairy systems,” Agricultural Systems, vol. 162, May 2018. https://doi.org/10.1016/j.agsy.2018.01.026
- See website of the Livelihoods Funds: http://www.livelihoods.eu/l3f/
- See FERN, “Unearned credit: Why aviation industry forest offsets are doomed to fail,” November 2017. http://fern.org/sites/default/files/news—pdf/Unearned%20Credit_0.pdf; WRM and Re:Common,” Rio Tinto’s biodiversity offset in Madagascar – Double landgrab in the name of biodiversity?,”April 2016. http://wrm.org.uy/books—and—briefings/rio—tintos—biodiversity—offset—in—madagascar—double—landgrab—in—the—name—of—biodiversity/
- In a 2017 presentation to investors, Fonterra indicates that their ambition for 2025 is to be producing 30 billion litres a year (equivalent to 31,050,000 MT), a 40% increase over their 2015 volume. See Fonterra, Investor Day presentation, p. 72, February 2017. https://www.fonterra.com/content/dam/fonterradotcom—www2/files/financial—docs/financial—results/Fonterra_Investor_Day_Presentation.pdf
- In 2017, WH Group generated 43.1 % of its “underlying operating profit” from China compared to 49.6% from the U.S. In 2016, the company generated 46% of its profits from China. Source: WH Group 2017, March 2018. http://webcast.openbriefing.com/0288_FY2017_ENG/; and 2016 Annual Results, March 2017. http://webcast.openbriefing.com/0288_FY2016_ENG/resources/0288_FY2016_Presentation_ENG.pdf
- See Tyson website. https://www.tysonsustainability.com/environment/energy—and—emissions.php
- See Cargill website. https://www.cargill.com/story/cargill—sets—new—goal—to—address—climate—change
- Tyson, Investor presentation, May 2014. http://s1.q4cdn.com/900108309/files/doc_presentations/2014/TSN%20Investor%20Presentation%20May%202014_v001_v0n7dr.pdf; Marfrig, “Marfrig Day,” March 2015. http://ir.marfrig.com.br/en/documentos/3674_marfrig_day_2015—03—01_eng_final—full.pdf
- Eric Schroeder, “Marfrig Global Foods to acquire 51% stake in National Beef,” Food Business News, 10 April 2018. https://www.foodbusinessnews.net/articles/11615—marfrig—global—foods—to—acquire—51—stake—in—national—beef
- Arla, “Good Growth 2020.” https://www.arla.com/company/strategy/strategy—2020/for—our—farmer—owners/
- “Tyson COO says ‘new paradigm’ in effect for protein,” March 2011. http://ir.tyson.com/investor—relations/news—releases/news—releases—details/2011/Tyson—COO—Says—New—Paradigm—in—Effect—for—Protein/default.aspx
- Oscar Rousseau, “EU and Japan FTA to boost beef and pork sales,” Global Meat News, July 2017. https://www.globalmeatnews.com/Article/2017/07/06/EU—and—Japan—FTA—to—boost—beef—and—pork—sales
- d;">EU, “EU export of dairy products to third countries,” February 2018. https://ec.europa.eu/agriculture/sites/agriculture/files/market—observatory/milk/pdf/eu—historical—trade—series_en.pdf; Based on data from the U.S. International Trade Commission: https://dataweb.usitc.gov/
- Ervin, Alexander M., et al., “Beyond Factory Farming: Corporate Hog Barns and the Threat to Public Health, the Environment and Rural Communities”, p. 3., Canadian Centre for Policy Alternatives, 2003, accessed at https://www.policyalternatives.ca/sites/default/files/uploads/publications/National_Office_Pubs/hogbarns.pdf
- Food and Water Watch, “Factory Farm Nation 2015 Edition,” p. 11, 2015, accessed at: https://www.foodandwaterwatch.org/sites/default/files/factory-farm-nation-report-may-2015.pdf
- Ibid.
- Shefali Sharma, “The Rise of Big Meat: Brazil’s Extractive Industry,” IATP, 2017. https://www.iatp.org/the—rise—of—big—meat
- Gérard Le Puill, “L’Europe veut—elle ruiner ses paysans en amplifiant le réchauffement climatique?” Humanité, 13 March 2018. https://www.humanite.fr/leurope—veut—elle—ruiner—ses—paysans—en—amplifiant—le—rechauffement—climatique—651877
- See IATP, Greenpeace and CCPA Briefing Papers 1—3, September 2017. https://www.iatp.org/documents/ceta—european—food—and—agriculture—standards—under—threat
- NZDairy, the New Zealand dairy lobby group, is one of the pioneers of this argument. See, e.g., its submission on the Climate Change Response (Moderated Emissions Trading) Amendment Bill in October 2009: https://www.dairynz.co.nz/media/424953/inside_dairy_december_2009.pdf
- “Of the cheese imported by China 70% to 80% is used by the food service sector in products such as pizzas.” Susan Kilsby, “China’s big milk deficit persists,” AgriHQ, 27 March 2018. https://agrihq.co.nz/topic/markets-and-data/view/chinas-big-milk-deficit-persists; Andrea Hogan, “Chinese demand for infant formula expected to keep growing, Mintel,” Australian Food News, 17 May 2017. http://www.ausfoodnews.com.au/2017/05/17/chinese—demand—for—infant—formula—expected—to—keep—growing—mintel.html
- E. Gooch, R. Hoskin and J. Law, “China Dairy Supply and Demand,” USDA, December 2017. https://www.ers.usda.gov/webdocs/publications/86231/ldpm-282-01.pdf?v=43084
- Peggy Lowe, “We Spoke With New Ag Secretary Sonny Perdue. Here’s What He Said On Climate Change And Immigration,” Harvest Public Media, May 2017. http://harvestpublicmedia.org/post/we—spoke—new—ag—secretary—sonny—perdue—heres—what—he—said—climate—change—and—immigration. For Pruitt, see p. 266–9 (letters from cattle lobbies in support of Pruitt for EPA head), accessed at: https://www.govinfo.gov/content/pkg/CHRG—115shrg24034/pdf/CHRG—115shrg24034.pdf
- Scott Pruitt resigned as this report was going to publication, to the disappointment of the U.S. beef lobby: “NCBA Regrets Scott Pruitt’s Decision to Resign as EPA Chief, Defends Work as Regulatory Reformer”, Oklahoma Farm Report, 6 July 2018: https://player.fm/series/beef—buzz—with—ron—hays—on—ron—radio—oklahoma—network/ncba—regrets—scott—pruitts—decision—to—resign—as—epa—chief—defends—work—as—regulatory—reformer
- U.S. Dairy Export Council.
- “Em Roma, ministro Blairo Maggi defende consumo mundial de carne,” Hiper Noticias, July 2017. http://www.hipernoticias.com.br/politica/em—roma—ministro—blairo—maggi—defende—consumo—mundial—de—carne/76948
- See for instance, Brad Brooks and Lisandra Paraguassu, “Brazil plea—bargain testimony says president took $4.6 million in bribes.” Reuters, 17 May, 2017. https://www.reuters.com/article/us—brazil—corruption/brazil—plea—bargain—testimony—says—president—took—4—6—million—in—bribes—idUSKCN18E1YX
- Though 80% of the world’s governments include agriculture in mitigation plans and 64% of them include it in climate adaptation strategies, few provide details on how to implement them. See Richards, M., Bruun, T. B., Campbell, B. M., Gregersen, L. E., Huyer, S., Kuntze, V., Madsen STN., Oldvig MB. and Vasileiou, I., “How countries plan to address agricultural adaptation and mitigation: An analysis of intended nationally determined contributions,” CCAFS dataset, 2016. http://hdl.handle.net/10568/73255
- Tara Ritter, “Hidden props for factory farms in California’s climate programs.” IATP blog, October 31, 2017. https://www.iatp.org/blog/201711/hidden—props—factory—farms—california—climate—programs
- See website of Global Research Alliance: https://globalresearchalliance.org/
- For an analysis of the emergence of the concept of “emissions intensity” in the international debate on agriculture and climate change, see Kalyn Simon, “What’s at steak? The political discourse of greenhouse gas emissions and the implication of animal agriculture,” 2017. https://repository.usfca.edu/thes/257/. Simon found that “emissions intensity” in agriculture was not mentioned in any of the first four IPCC assessment reports but appears 14 times in the Fifth Assessment Report (AR5) of 2014.
- FAO, “Livestock’s Long Shadow: Environmental Issues and Options,” 29 November 2006. http://www.fao.org/3/a—a0701e.pdf
- Juliette Jowit, “Corporate lobbying is blocking food reforms, senior UN official warns,” Guardian, 22 September 2010. https://www.theguardian.com/environment/2010/sep/22/food—firms—lobbying—samuel—jutzi
- Ibid.
- See report from the CLITRAVI—UECBV Joint Meat Sector Taskforce on Climate Change Issues in the November 2012 CLITRAVI—UECBV newsletter: http://www.vilt.be/application/public/upload/35/default/35914.pdf
- Dario Caro et al., “Global and regional trends in greenhouse gas emissions from livestock,” Climatic Change 126, nos. 1–2 (September 1, 2014): 203–16, https://doi.org/10.1007/s10584—014—1197—x.
- Dario Caro et al., “Greenhouse gas emissions due to meat production in the last fifty years,” in Quantification of Climate Variability, Adaptation and Mitigation for Agricultural Sustainability (Springer, Cham, 2017), 27–37, https://doi.org/10.1007/978—3—319—32059—5_2.
- UN FAO, FAOSTAT database, “Livestock Primary” http://www.fao.org/faostat/en/#data/QL
- For a discussion of the limitations of emissions intensification, see Elin Röös et al., “Greedy or needy: Land use and climate impacts of food in 2050 under different livestock futures,” Global Environmental Change, vol. 47, November 2017. https://doi.org/10.1016/j.gloenvcha.2017.09.001; See also, Gerber, Pierre, Theun Vellinga, Carolyn Opio, and Henning Steinfeld. “Productivity gains and greenhouse gas emissions intensity in dairy systems.” Livestock Science 139, nos. 1–2 (July 2011): 100–108. Questions have also been raised about the potential of intensification practices to reduce GHG emissions from Brazilian cattle: Jonathan Gonçalves da Silva et al. “Livestock intensification as a climate policy: Lessons from the Brazilian case,” Land Use Policy, vol. 62, March 2017. https://doi.org/10.1016/j.landusepol.2016.12.025
- According to Professor Richard Eckard, science adviser to the FAO on climate change, “There is no technological solution currently available to significantly reduce greenhouse gas emissions from farming”: http://carbonfarmingknowledge.com.au/wp—content/uploads/2013/11/2016—03—27—Eckard—Carbon—Update_FINAL.pdf
- A recent study of the Dutch dairy sector is also indicative. It not only shows that the emissions per kilogram of milk decreased from 1990—2011 but have since gone up but also that the Dutch dairy industry underestimated its baseline emissions per kilogram of milk by 19%. See A.G. Dolfing, “Scenarios for reducing the greenhouse gas emissions of the Dutch dairy sector,” MSc thesis, Utrecht University, July 2017. https://dspace.library.uu.nl/handle/1874/352967
- See for example “Factory farming in America: The true cost of animal agribusiness for rural communities, public health, families, farmers, the environment, and animals,” Humane Society, 2008. http://www.humanesociety.org/assets/pdfs/farm/hsus—factory—farming—in—america—the—true—cost—of—animal—agribusiness.pdf
- Peter Stevensen from Compassion in World Farming contributed this box.
- European Commission, 2017. “Overview Report: Welfare of Cattle on Dairy Farms,” 2017. http://ec.europa.eu/food/audits-analysis/overview_reports/act_getPDF.cfm?PDF_ID=1139
- “Scientific opinion of the Panel on Animal Health and Welfare on a request from European Commission on welfare of dairy cows.” EFSA Journal (2009) 1143, 1–38.
- Knowles, T. G., Kestin, S. C., Haslam, S. M., Brown, S. N., Green, L. E., Butterworth, A., Pope, S. J., Pfeiffer, D. and Nicol, C. J., “Leg disorders in broiler chickens: prevalence, risk factors and prevention,” Plos one 3(2): e1545, 2008. https://doi.org/10.1371/journal.pone.0001545
- European Commission, “Study of the impact of genetic selection on the welfare of chickens bred and kept for meat production,” 2016.
- Laywell, “Welfare implications of changes in production systems for laying hens: Deliverable 7.1.” http://www.laywel.eu/web/pdf/deliverable%2071%20welfare%20assessment.pdf
- Lundqvist, J., de Fraiture, “C. Molden, D., Saving Water: From Field to Fork – Curbing Losses and Wastage in the Food Chain,” SIWI Policy Brief, 2008. http://www.siwi.org/wp-content/uploads/2015/09/PB_From_Filed_to_fork_2008.pdf
- Nellemann, C., MacDevette, M., Manders, et al., “The Environmental Food Crisis – The Environment’s Role in Averting Future Food Crises. A UNEP rapid response assessment,” United Nations Environment Programme, GRID—Arendal. https://www.unenvironment.org/resources/report/environmental-food-crisis
- Ibid.
- Bailey R et al., “Livestock – Climate Change’s Forgotten Sector,” Chatham House, 2014. See also, IEED briefing, “Sustainable Intensification revisited,” March 2015. http://pubs.iied.org/17283IIED.html
- Bajželj B. et al., “Importance of food—demand management for climate mitigation.” Nature Climate Change, 2014. http://www.nature.com/doifinder/10.1038/nclimate2353
- FAO, “Tackling Climate Change through Livestock,” 2013.
- See for example, Sienna Chrisman, “Viewers Guide. Under Contract: Farmers and the fine print” RAFI USA, 2016. http://rafiusa.org/undercontractfilm/wp—content/uploads/2017/01/Under_Contract_Viewers—Guide_2017_ReducedFileSize.pdf
- For a discussion on animals and agroecological systems/environmental sustainability, see: P. L. Stanley et al., “Impacts of soil carbon sequestration on life cycle greenhouse gas emissions in Midwestern USA beef finishing systems” Agricultural Systems 162, 2018. M.G. Rivera—Ferre et al, “Re—framing the climate change debate in the livestock sector: mitigation and adaptation options in the livestock sector,” Wiley Interdisciplinary Reviews: Climate Change, 2016. C. Kremen et al, “Diversified Farming Systems: An Agroecological, Systems—based Alternative to Modern Industrial Agriculture,” Ecology and Society, 17(4), 44, 2012. M.P. Russelle et al., “Reconsidering integrated crop—livestock systems in north America,” Agronomy Journal, 99(2), 325—334, 2007. See also, Food Climate Research Network, “Grazed and confused?,” 2017. https://www.fcrn.org.uk/sites/default/files/project—files/fcrn_gnc_report.pdf and Greenpeace International, “Less is More: Reducing meat and dairy for a healthier life and planet,” 2018. http://www.greenpeace.org/livestock_vision
On sustainable livestock and farmer incentives, policy, and public programs, see: R.D. Garrett et al., “Policies for Reintegrating Crop and Livestock Systems: A Comparative Analysis.” Sustainability, 9(3), 473, 2017. Also, Russell et al. 2007 above.
On animal welfare and environmental sustainability, see: M.T. Scholten et al., “Livestock farming with care: towards sustainable production of animal—source food,” 2013. FAO, webpage “Animal Welfare at the heart of sustainability” accessed at: http://www.fao.org/ag/againfo/home/en/news_archive/2014_Animal_Welfare_at_the_Heart_of_Sustainability.html.
- See for instance: “Working ‘The Chain,’ Slaughterhouse Workers Face Lifelong Injuries”, NPR, 11 April 2016. https://www.npr.org/sections/thesalt/2016/08/11/489468205/working—the—chain—slaughterhouse—workers—face—lifelong—injuries
- See, D. Gurian—Sherman, “CAFOs Uncovered: The Untold Costs of Confined Animal Feeding Operations,” Union of Concerned Scientists, April 2008. See also: E. Starmer and T. A. Wise, “Feeding at the Trough: Industrial Livestock Firms Saved $35 billion From Low Feed Prices,” Global Development and Environment Institute, Tufts University, Policy Brief No. 07—03, December 2007. http://www.ase.tufts.edu/gdae/Pubs/rp/PB07—03FeedingAtTroughDec07.pdf
Downloads
Download a PDF of the report.
Translations of the report
Download a French translation of the report. (Télécharger une traduction française du rapport.)
Download a German translation of the report. (Laden Sie eine deutsche Übersetzung des Berichts herunter.)
Download a Portuguese translation of the report. (Baixe uma tradução para o Português do relatório.)
Download a Spanish translation of the report. (Descargue una traducción al español del informe.)
Appendix
GHG emissions of the world's largest meat and dairy companies (by volume)
GHG emissions from meat and dairy production in the surplus countries, plus China
A note about our methodology
Original Datasets