The information in this document has been obtained from sources believed reliable and in good faith but any potential interpretation of this report as making an allegation against a specific company or companies named would be misleading and incorrect. The authors accept no liability whatsoever for any direct or consequential loss arising from the use of this document or its contents.
This report was written and researched by the Changing Markets Foundation and Institute for Agricultural and Trade Policy, in collaboration with independent researchers. We would like to thank all our contributors and reviewers.
Executive summary
This report for the first time estimates the methane emissions of five of the largest meat corporations and ten of the largest dairy corporations. Their combined methane emissions are roughly 12.8 million tonnes, which equates to over 80% of the European Union’s entire methane footprint. These companies’ emissions represent around 3.4% of all global anthropogenic methane emissions and 11.1% of the world’s livestock-related methane. The report also provides the latest estimates for the overall greenhouse gas (GHG) emissions of the same companies, which amount to around 734 million tonnes of CO2 equivalent – higher than the emissions of Germany. The report calls for urgent and ambitious legislation to address the significant climate impacts of global meat and dairy corporations and for governments to support a just transition for the transformation of industrial animal agriculture towards agroecology.
Climate change is wreaking havoc globally through more frequent and extreme weather events (floods, wildfires) and the slow-onset climate processes, such as droughts, desertification and sea level rise. Climate disruption is already affecting farmers everywhere, as our agricultural systems are uniquely dependent on stable climatic conditions. The higher global temperatures rise, the more alarming the disruptions to food production will become.
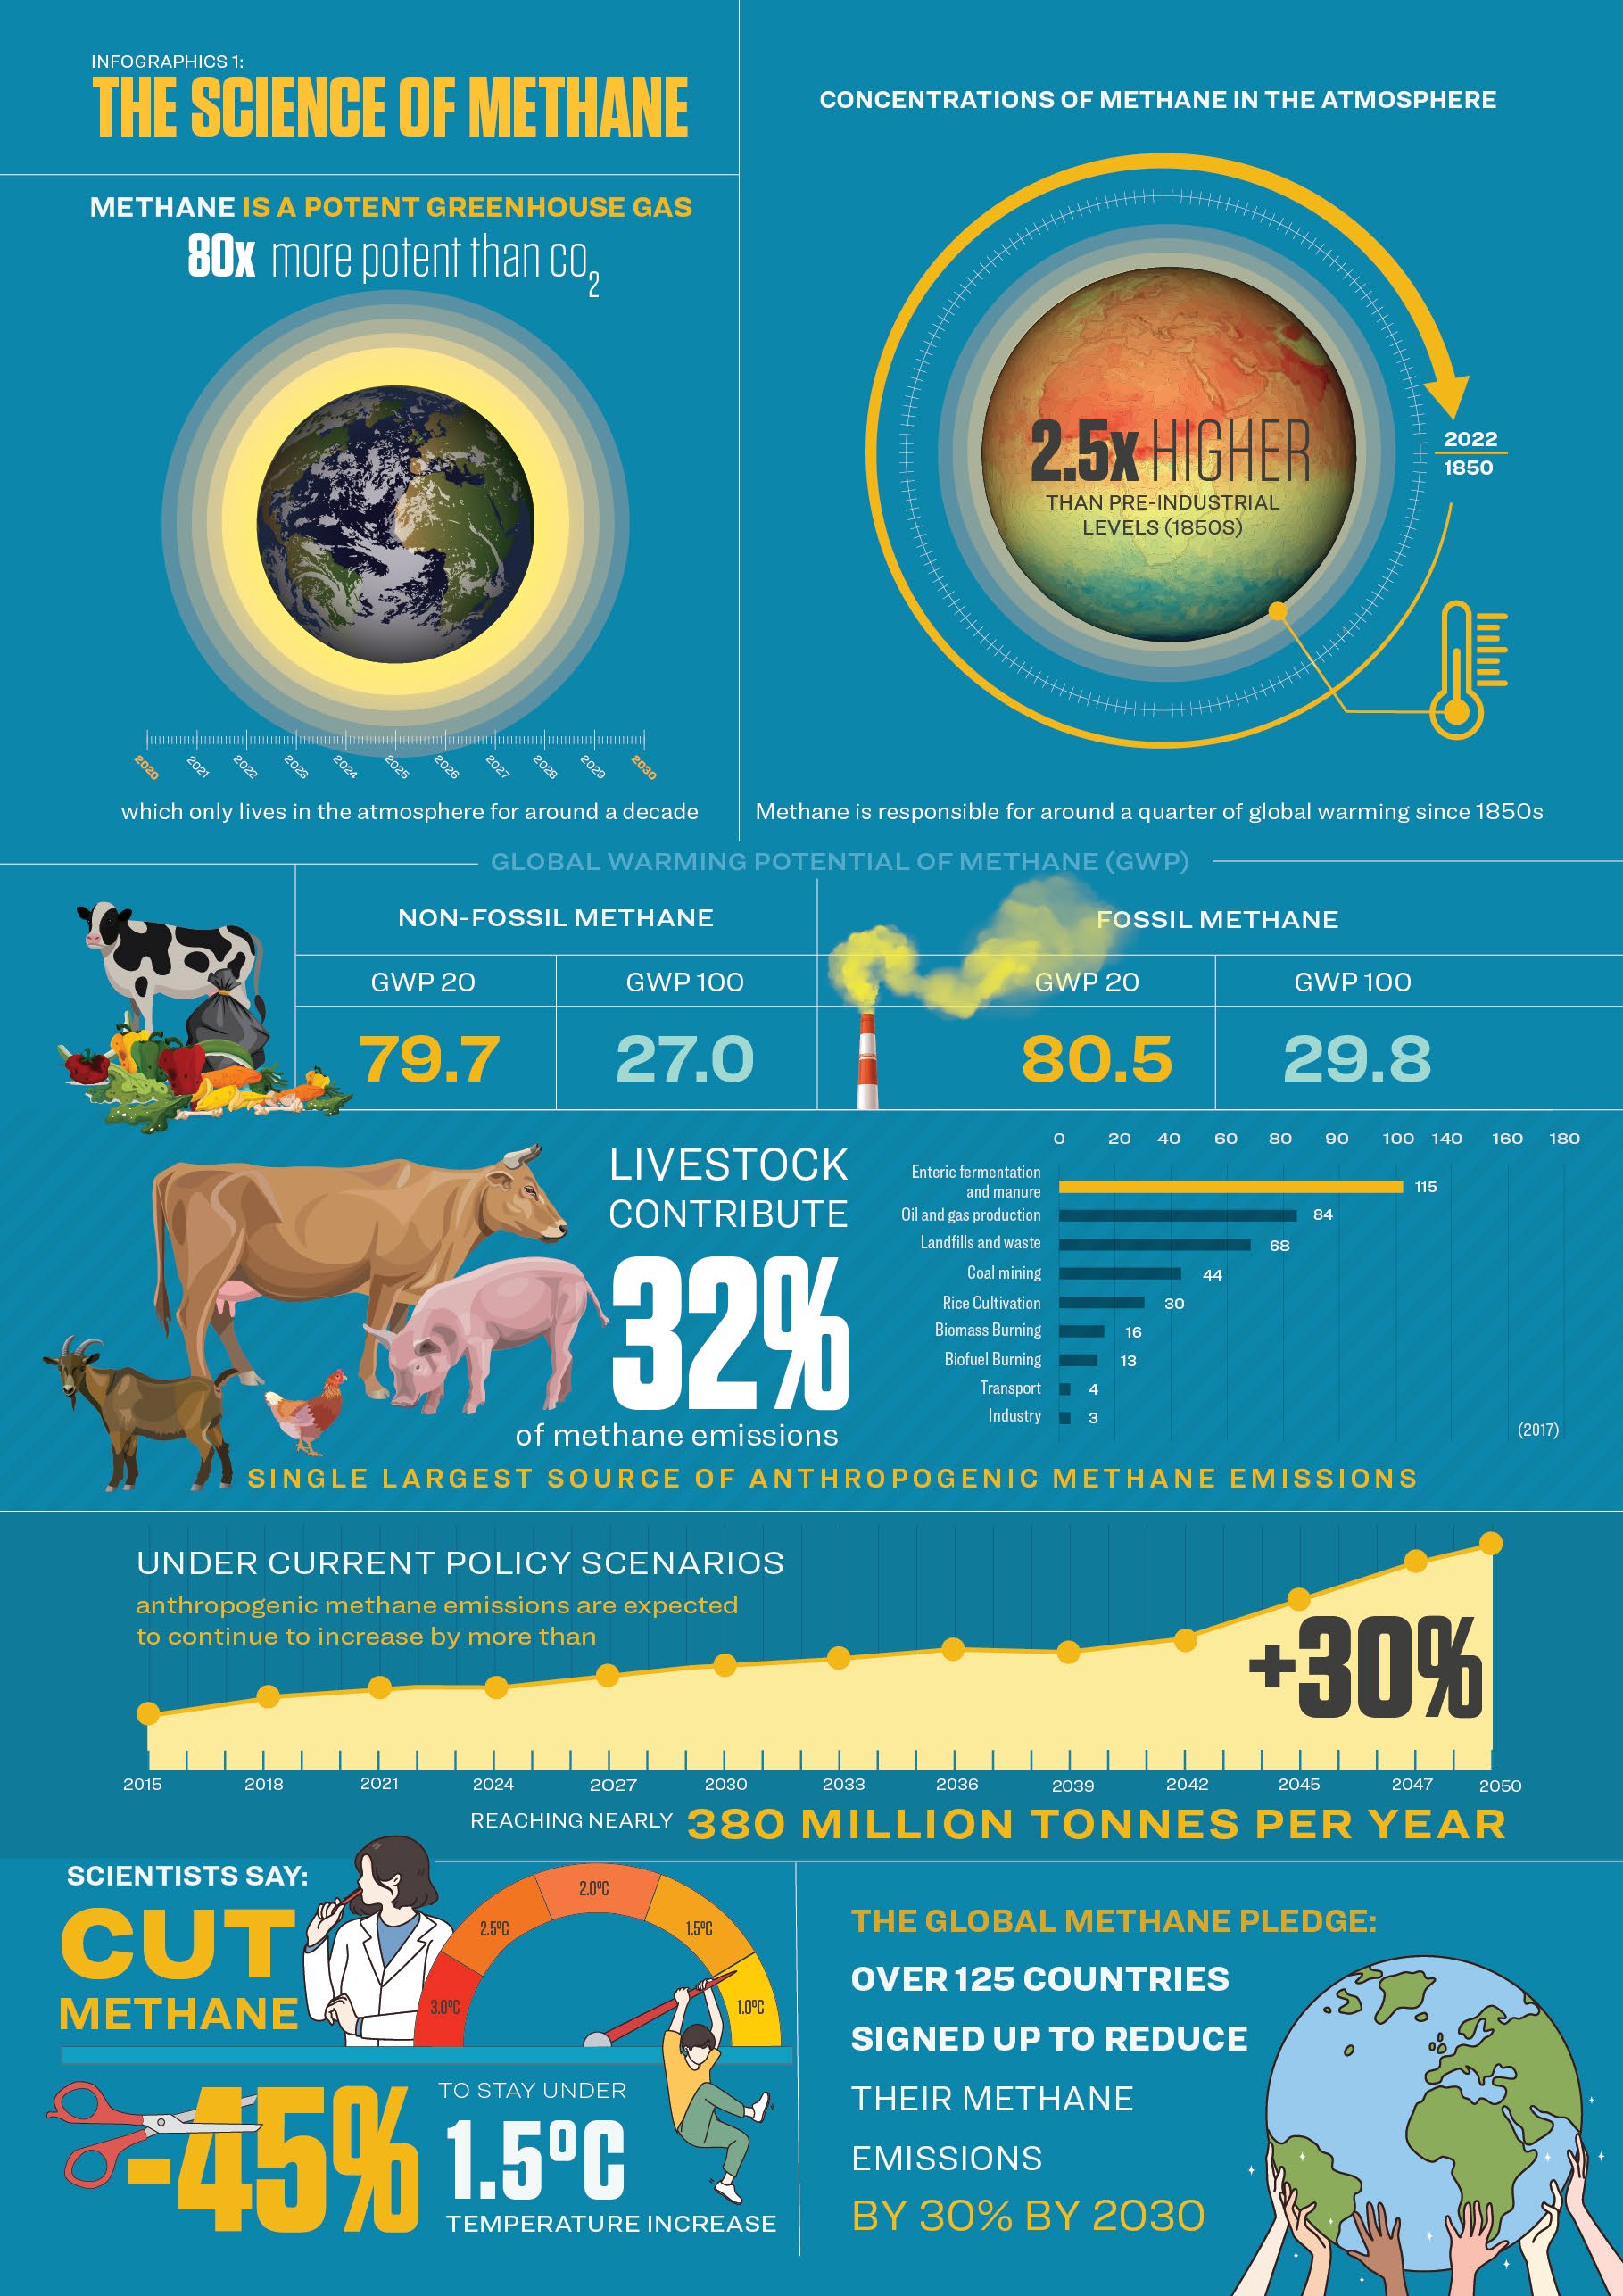
Rapid emissions cuts this decade are critical in preventing catastrophic climate change, according to the Intergovernmental Panel on Climate Change (IPCC).1 Methane emissions cuts have been identified in particular as key levers to avert both temperature overshoot and dangerous tipping points. Methane is a short-lived but extremely potent gas: it has around 80 times more warming potential than CO2 over a 20-year timespan, but only lives in the atmosphere for around a decade.2
According to the United Nations Environment Programme’s Global Methane Assessment, methane emissions should be reduced by at least 40-45% in this critical decade of climate action.3 Livestock agriculture is the single largest source of methane, responsible for around 32% of anthropogenic methane emissions.4 In this report we investigate the emissions of some of the biggest meat and dairy companies.
Key findings:
Our estimates show that the combined methane emissions of these 15 companies far exceed the entire methane footprint of many countries, including Russia, Canada, Australia and Germany. Their methane emissions are 52% higher than the livestock-related methane emissions of the EU and 47% higher than those of the US.
- Individual companies’ methane emissions are also comparable to countries’ livestock-related methane emissions. For instance, Marfrig’s methane emissions rival those of Australia’s entire livestock sector, Tyson’s are comparable to the Russian Federation’s, and Dairy Farmers of America’s to the livestock methane of the UK.
- JBS’s methane emissions far outpace all other companies. Its methane emissions exceed the combined livestock methane emissions of France, Germany, Canada and New Zealand or compare to 55% of US livestock methane.
- When calculated over a 20-year timescale, the more relevant scale for climate action, these emissions are even more significant, comprising anywhere from nearly half to three-quarters of these companies’ estimated GHG footprint, highlighting the urgent need for action on methane.
- Their total overall GHG emissions are also significant, slightly higher than the emissions of Germany. If these 15 companies were treated as a country, they would be the tenth largest GHG-emitting jurisdiction in the world.5 Their combined emissions also exceed those of oil companies such as ExxonMobil, BP and Shell.
- In spite of their massive climate impact, the majority of companies fail to report either total GHGs or methane-specific emissions. Nine out of 15 companies (60%) either do not report their emissions or do not report their total supply chain (scope 3) emissions. None of the companies reported their supply chain methane emissions.
Governments dragging their feet on livestock methane emissions
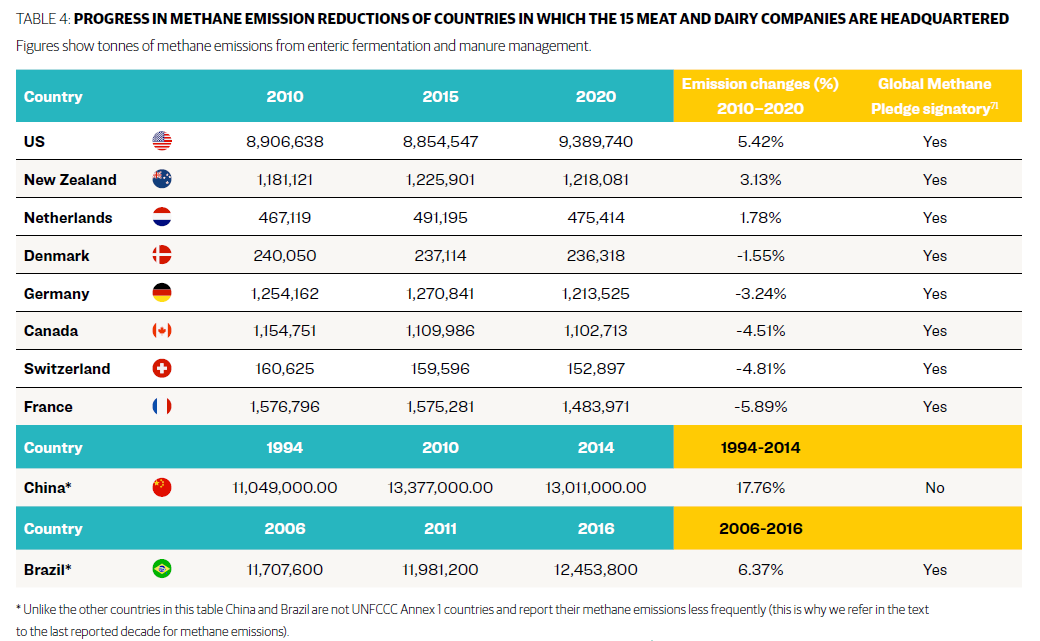
At COP26 in Glasgow, more than 110 countries committed to the Global Methane Pledge (‘the Pledge’), with the collective goal of reducing global methane emissions by 30% by 2030. The 15 companies analysed in this report are headquartered in ten countries around the world. All of them, with the exception of China, are signatories to the Pledge. Five of these countries have increased their livestock methane emissions over the last ten years as reported to the UN Framework Convention on Climate Change: US (over 5%), Brazil (over 6%), China (over 17%), New Zealand (over 3%) and the Netherlands (almost 2%). Five countries (Canada, Germany, Denmark, Switzerland and France) have achieved small reductions of livestock methane, but the pace of reductions is not in line with the Pledge. The only country with a reported decrease of more than 5% over the last decade is France, the biggest livestock methane emitter in the EU. Effective regulation of industrial livestock production is key to achieving required methane cuts and embarking on the transformation of the food system needed to meet global climate goals.
The way forward
Four years after the release of the first report in the Emissions Impossible series, publicly available data on corporate emissions remains incomplete, not comparable between companies or years and, in the majority of cases, absent. Basic information for independent emissions calculations like companies’ annual production figures for meat and milk per region are either not published by companies or inconsistently reported over time. In the absence of strong disclosure rules, voluntary climate targets and reporting are leading to pervasive levels of greenwashing. Mandatory reporting and independent verification are essential to gauge whether corporate net zero and other climate targets are even in the ballpark of limiting warming to 1.5°C. Potential new rules in the US and the EU for disclosure of emissions, climate risk and the prevention of greenwashing climate claims may be opportunities for change.
Time is of the essence in cutting back methane this decade. Yet policymakers have identified solutions that tinker around the edges of this extractive system of animal agriculture. Governments are limiting action to techno fixes without serious consideration of systemic transformations needed in the production, trade and consumption of livestock products. Acting on livestock methane requires a holistic understanding of the drivers of mass industrial animal production and multiple policy interventions to reduce the number of animals used for meat and dairy production. A comprehensive set of regulations is needed to ensure that the burden for emissions reduction rests on corporations that shape and drive the supply chain. Farmers within and outside these corporate supply chains must be supported to play a critical role in a sequenced, deliberate and just transition out of mass industrial livestock production towards agroecological systems that are healthy for the planet and people.
IATP and Changing Markets’ recommendations for governments:
-
Set binding GHG and methane reduction targets for the agriculture sector in line with the global goal of limiting temperature increase to 1.5°C.
-
Require companies to consistently and comprehensively report their GHG emissions, including scope 3, and set emission-reduction targets in line with science, including a system of independent third-party verification. Methane, nitrous oxide and carbon dioxide emissions must be reported separately.
-
Enact a phased and bottom-up transition for farms to reduce animal numbers in line with a just transition policy for the transformation of the animal agriculture sector.
-
Regulate all pollutants (besides methane) from mass industrial livestock production to facilitate a transition from this model of animal agriculture towards agroecology.
-
Reform agriculture policy (the EU’s Common Agricultural Policy, the US’ Farm Bill, etc.) to support higher environmental and social outcomes and drive an agroecological transformation of the sector, away from mass industrial livestock production towards livestock systems that are healthy for the planet and people. This includes removing subsidies for mass production of feed grains and making farm support dependent on positive environmental and social outcomes.
Recommendations for companies:
-
Set emissions reduction targets and action plans in line with the global goal of limiting temperature increase to 1.5°C. The focus must be on reducing the company’s absolute emissions, rather than emissions intensity, including scope 3 emissions. Companies should also include transparent reporting, including slaughter numbers and milk intake, to enable independent verification of their climate-related disclosures.
-
Establish separate methane reduction targets and action plans to meet them, including separate reporting of methane emissions. Reporting should also include disclosure of investments in climate mitigation and adaptation measures.
-
Reduce the number of animals in global supply chains and create a bottom-up just transition plan with farmers and workers in your global supply chains.
-
Support progressive climate, environmental and health policies that will drive a shift to healthier and more environmentally sustainable diets.
1. Introduction: the urgency of addressing livestock methane
“We are at a crossroads. The decisions we make now can secure a liveable future. We have the tools and know-how required to limit warming.”
These were the words of Hoesung Lee, Chair of the Intergovernmental Panel on Climate Change (IPCC), in April 2022.6 The IPCC’s Sixth Assessment report on mitigation went further to state that deep greenhouse gas (GHG) emissions reductions, particularly in methane, in the next decade would ‘lower peak warming, reduce the likelihood of overshooting warming limits and lead to less reliance on net negative CO2 emissions’ post-2050.7
Methane persists in the atmosphere for around a decade, but despite its relatively short lifespan, it is a potent greenhouse gas – around 80 times more powerful than CO2 over a 20-year timeframe.8 Concentrations of methane in the atmosphere are 2.5 times higher than pre-industrial levels (1850s) and methane is responsible for around a quarter of global warming since then.9 These unique properties have led climate scientists to call for rapid cuts in methane this decade. This would buy us valuable time to avoid dangerous climate tipping points and to give humanity a chance to stay under a 1.5°C temperature increase while societies act to transition to zero emissions. Animal agriculture contributes 32% of the world’s methane emissions, making it the single largest source of human-made methane emissions.10
Although animal agriculture has started to get more attention for its contribution to climate change, the emissions of big meat and dairy companies remain below the radar for urgent climate action. Animal agriculture is responsible for 57% of emissions linked to agricultural production, which accounts for an estimated 37% of all global emissions.11 Even if the world immediately stopped using all fossil fuels, scientists say that current emissions from the global food system would make it impossible to limit warming to 1.5°C and difficult even to realise the 2°C target.12
This report, for the first time, estimates the methane footprint of some of the biggest meat and dairy corporations and provides comparisons to methane emissions of countries. The report also provides the latest GHG estimates for these companies and compares them with the carbon footprint of oil companies. Meat and dairy corporations are responsible for massive quantities of methane emissions as they process millions of animals around the world. In spite of their enormous climate impact, meat and dairy companies continue to operate in a regulatory vacuum, when it comes to reporting and reducing their GHG emissions.
To highlight the scale of these companies’ emissions and their lack of climate action, the Institute for Agriculture and Trade Policy (IATP) published its first Emissions Impossible report with GRAIN in 2018.13 The first report estimated livestock-related GHG emissions of 35 of the largest global meat and dairy corporations.14 The report also concluded that ‘publicly available data on [corporate] emissions [is] incomplete, not comparable between companies or years and, in the majority of cases, simply absent.’15
Since 2018, IATP has published two further reports in its Emissions Impossible series.A This fourth report in the series, published jointly with the Changing Markets Foundation, analyses the magnitude of the methane and total livestock emissions of ten global dairy and five global meat processing corporations. We selected companies with headquarters in the leading livestock-producing countries as a representative sample of the livestock industry’s efforts to address methane and overall GHG emissions. See Box 1 for a short description of our methodology.
Credit: Shutterstock
Box 1.1: Methodology – in brief
In this report, the Changing Markets Foundation and IATP use the same basic methodology for calculating corporate livestock emissions that was first developed by GRAIN and IATP for the 2018 Emissions Impossible report.B We used the UN Food and Agriculture Organization (FAO) Global Livestock Environmental Assessment Model (GLEAM), a globally recognised model developed in collaboration with the livestock industry for our emissions calculations. For a detailed description of the methodology, see Annex 1.
We included double the number of dairy corporations compared to meat, given the relative difficulty of obtaining consistent, or at times any, public data on animal slaughter from the biggest meat corporations. We chose five meat corporations based on the size of their operations and regional representation. Only two of these companies published their 2021 slaughter numbers (number of animals that were processed in that year). JBS, the world’s largest meat company, Marfrig, the second largest beef producer and Tyson, the world’s second largest meat company did not publish their slaughter numbers. For these companies, we used their slaughter processing capacity data, adjusted by utilisation rate (see also Box 3). In contrast, the milk intake data of the top 20 dairy processing corporations is published by the IFCN Dairy Research Network every two years.16 We chose ten of the companies listed in the IFCN Dairy Research ranking 2020, to represent a geographically diverse sample of dairy companies.
We contacted all companies selected for this report at the end of August 2022, asking them to provide information on total volumes and regional breakdown of their milk intake or slaughter data, including any GHG emission estimates for their operations for the years 2020 and 2021. Any relevant information that was provided has been incorporated in our analysis.
GHG emissions for each company were calculated by combining regional production estimates with regional average GHG emissions intensity data for meat (cattle, pigs and chickens) and milk production from GLEAM, the most up-to-date values available from the FAO’s livestock emissions model at the time of writing.C The GLEAM emissions factors are disaggregated by emissions source and by GHG, allowing emissions of CO2, methane and nitrous oxide to be estimated and expressed in terms of tonnes of carbon dioxide equivalent (CO2e) emissions. We have made one specific modification to the GLEAM methodology in this report: we have updated methane’s global warming potential (GWP) with the factors provided in the latest IPCC report (AR6) to reflect the most up-to-date science on methane’s contribution to global warming (see also Box 2).
Our calculations serve as indicators of the scale of these corporations’ livestock-related emissions. Precise estimates of corporate emissions can only be achieved through full disclosure and third-party independent verification of company data, including the number of animals in their global operations. The aim of this report is to highlight the magnitude of their emissions and the urgency for governments to enact mandatory reporting and emissions reductions from the livestock industry.
2. The staggering scale of livestock methane emissions
2.1 Why is livestock methane a problem?
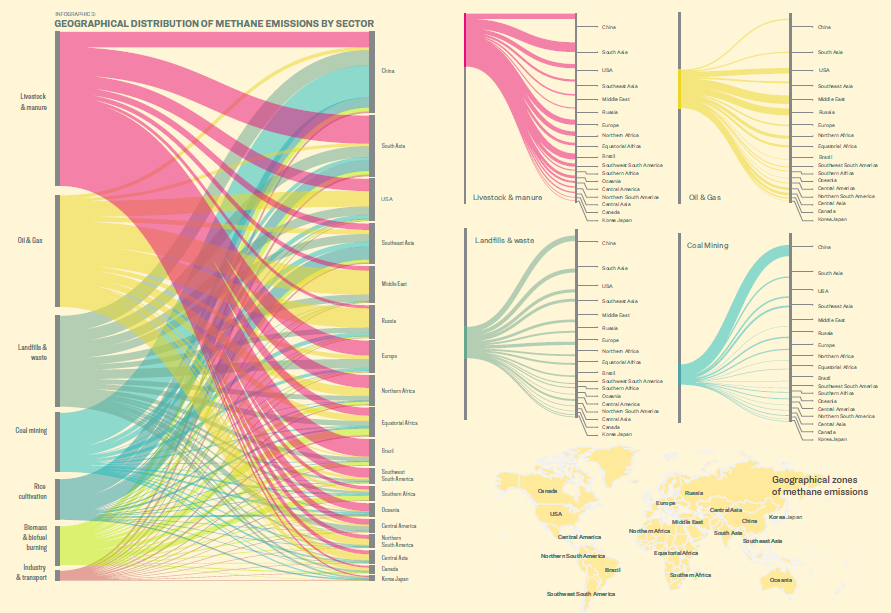
It is urgent to reduce warming in the short term, yet methane emissions increased by 9% between 2008 to 2017 compared to the previous decade.17 Under current policy scenarios, anthropogenic methane emissions are expected to increase by 30% between 2015 and 2050.18 The single largest source of manmade methane is manure management and enteric fermentation in ruminant animals, a process where micro-organisms create methane in the stomachs of animals such as cows, sheep and goats. As Infographic 2 shows, methane emissions from manure and enteric fermentation are even greater than from oil and gas production.19
To tackle these emissions in a substantive manner, the number of animals in mass industrial systems of production must be dramatically reduced. This is the most effective measure to reduce emissions from animals themselves and emissions from their manure. Though it emits less methane into the atmosphere than enteric fermentation, largescale production and dispersal of manure (associated with industrial pork, dairy and beef production) is highly polluting. It contaminates soil, water and air with nitrates and ammonia. Manure also emits nitrous oxide, which is a greenhouse gas 273 times more potent than CO2 over both a 20- and 100-year time horizon (see Table 5 in Annex 1).20
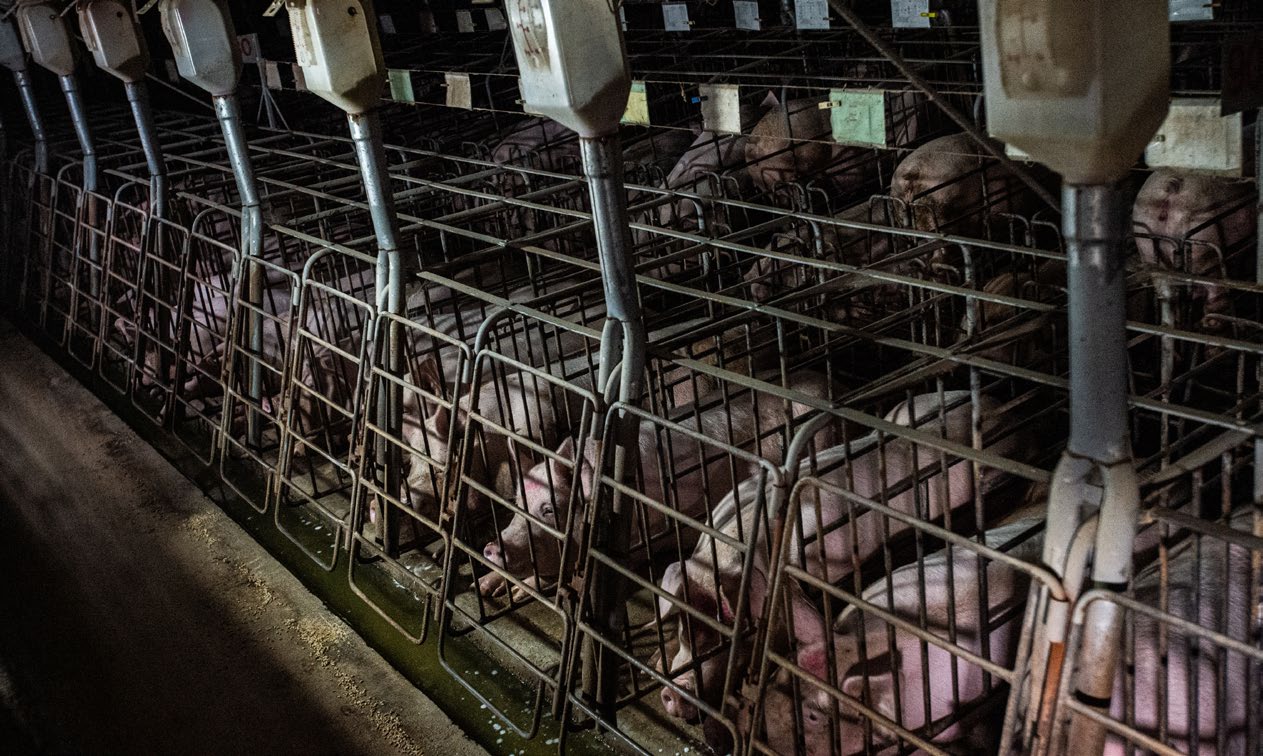
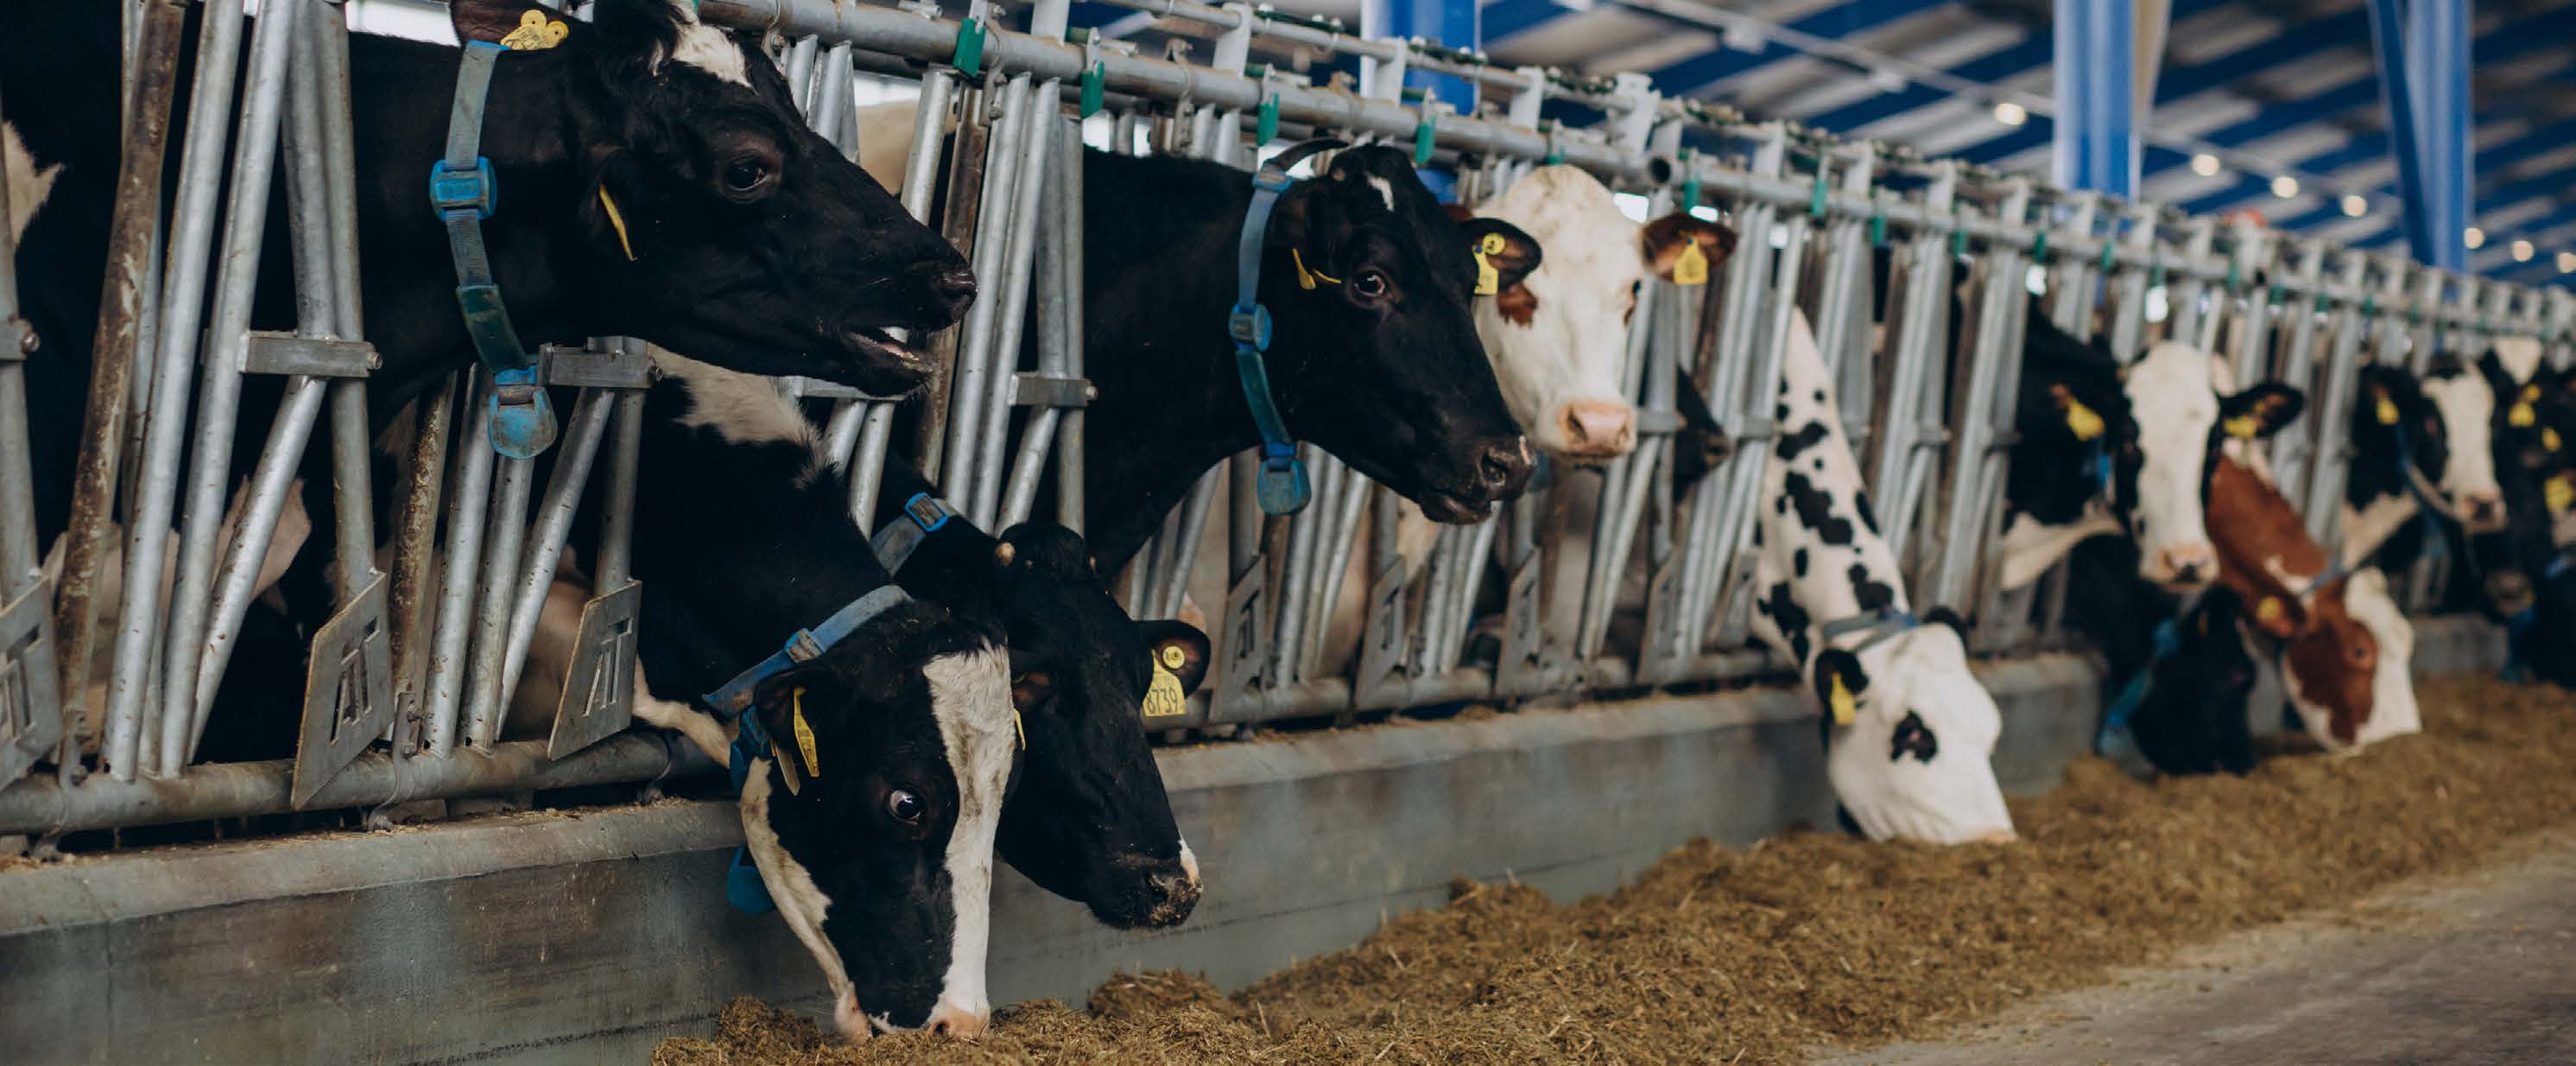
Credits: Jo-Anne McArthur/We Animals Media
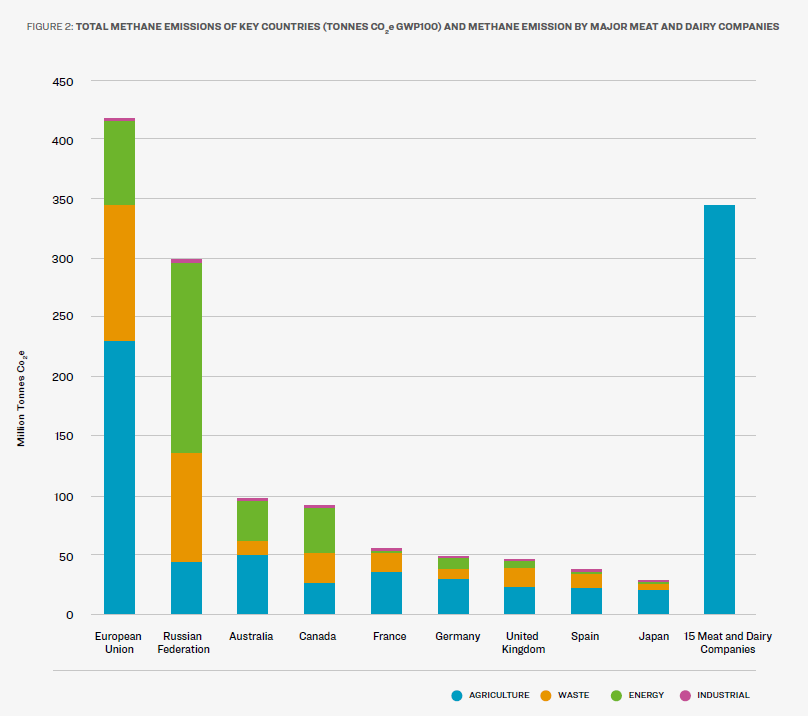
Sources: Meat and dairy companies: calculated by Changing Markets and IATP (2020–1); Regions: UNFCC greenhouse gas inventory (2020) https://di.unfccc.int
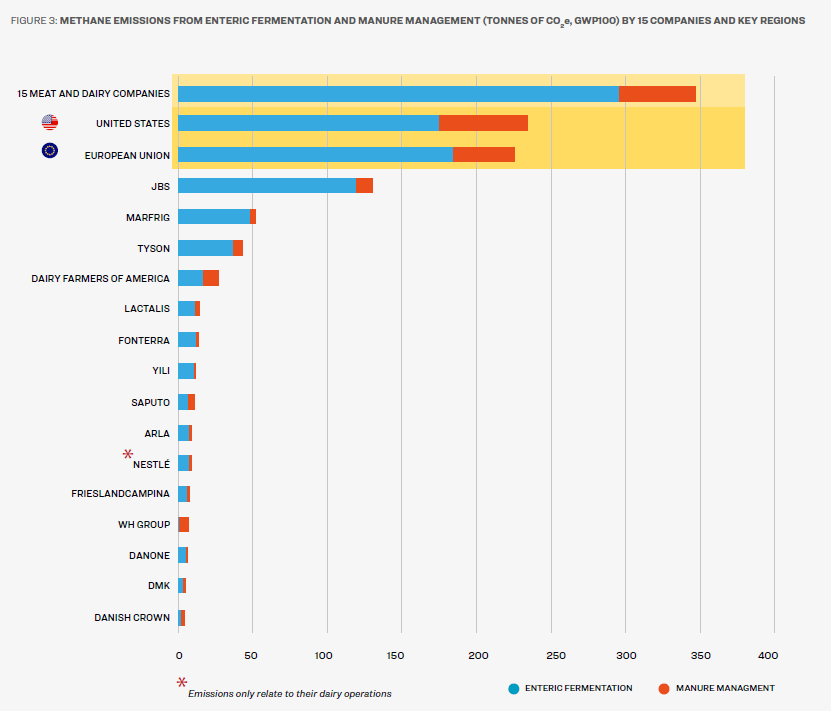
Sources: Meat and dairy companies: calculated by Changing Markets and IATP (2020–1); Regions: UNFCC greenhouse gas inventory (2020) https://di.unfccc.int
2.2 Methane giants: How big meat and dairy companies’ methane emissions compare with countries
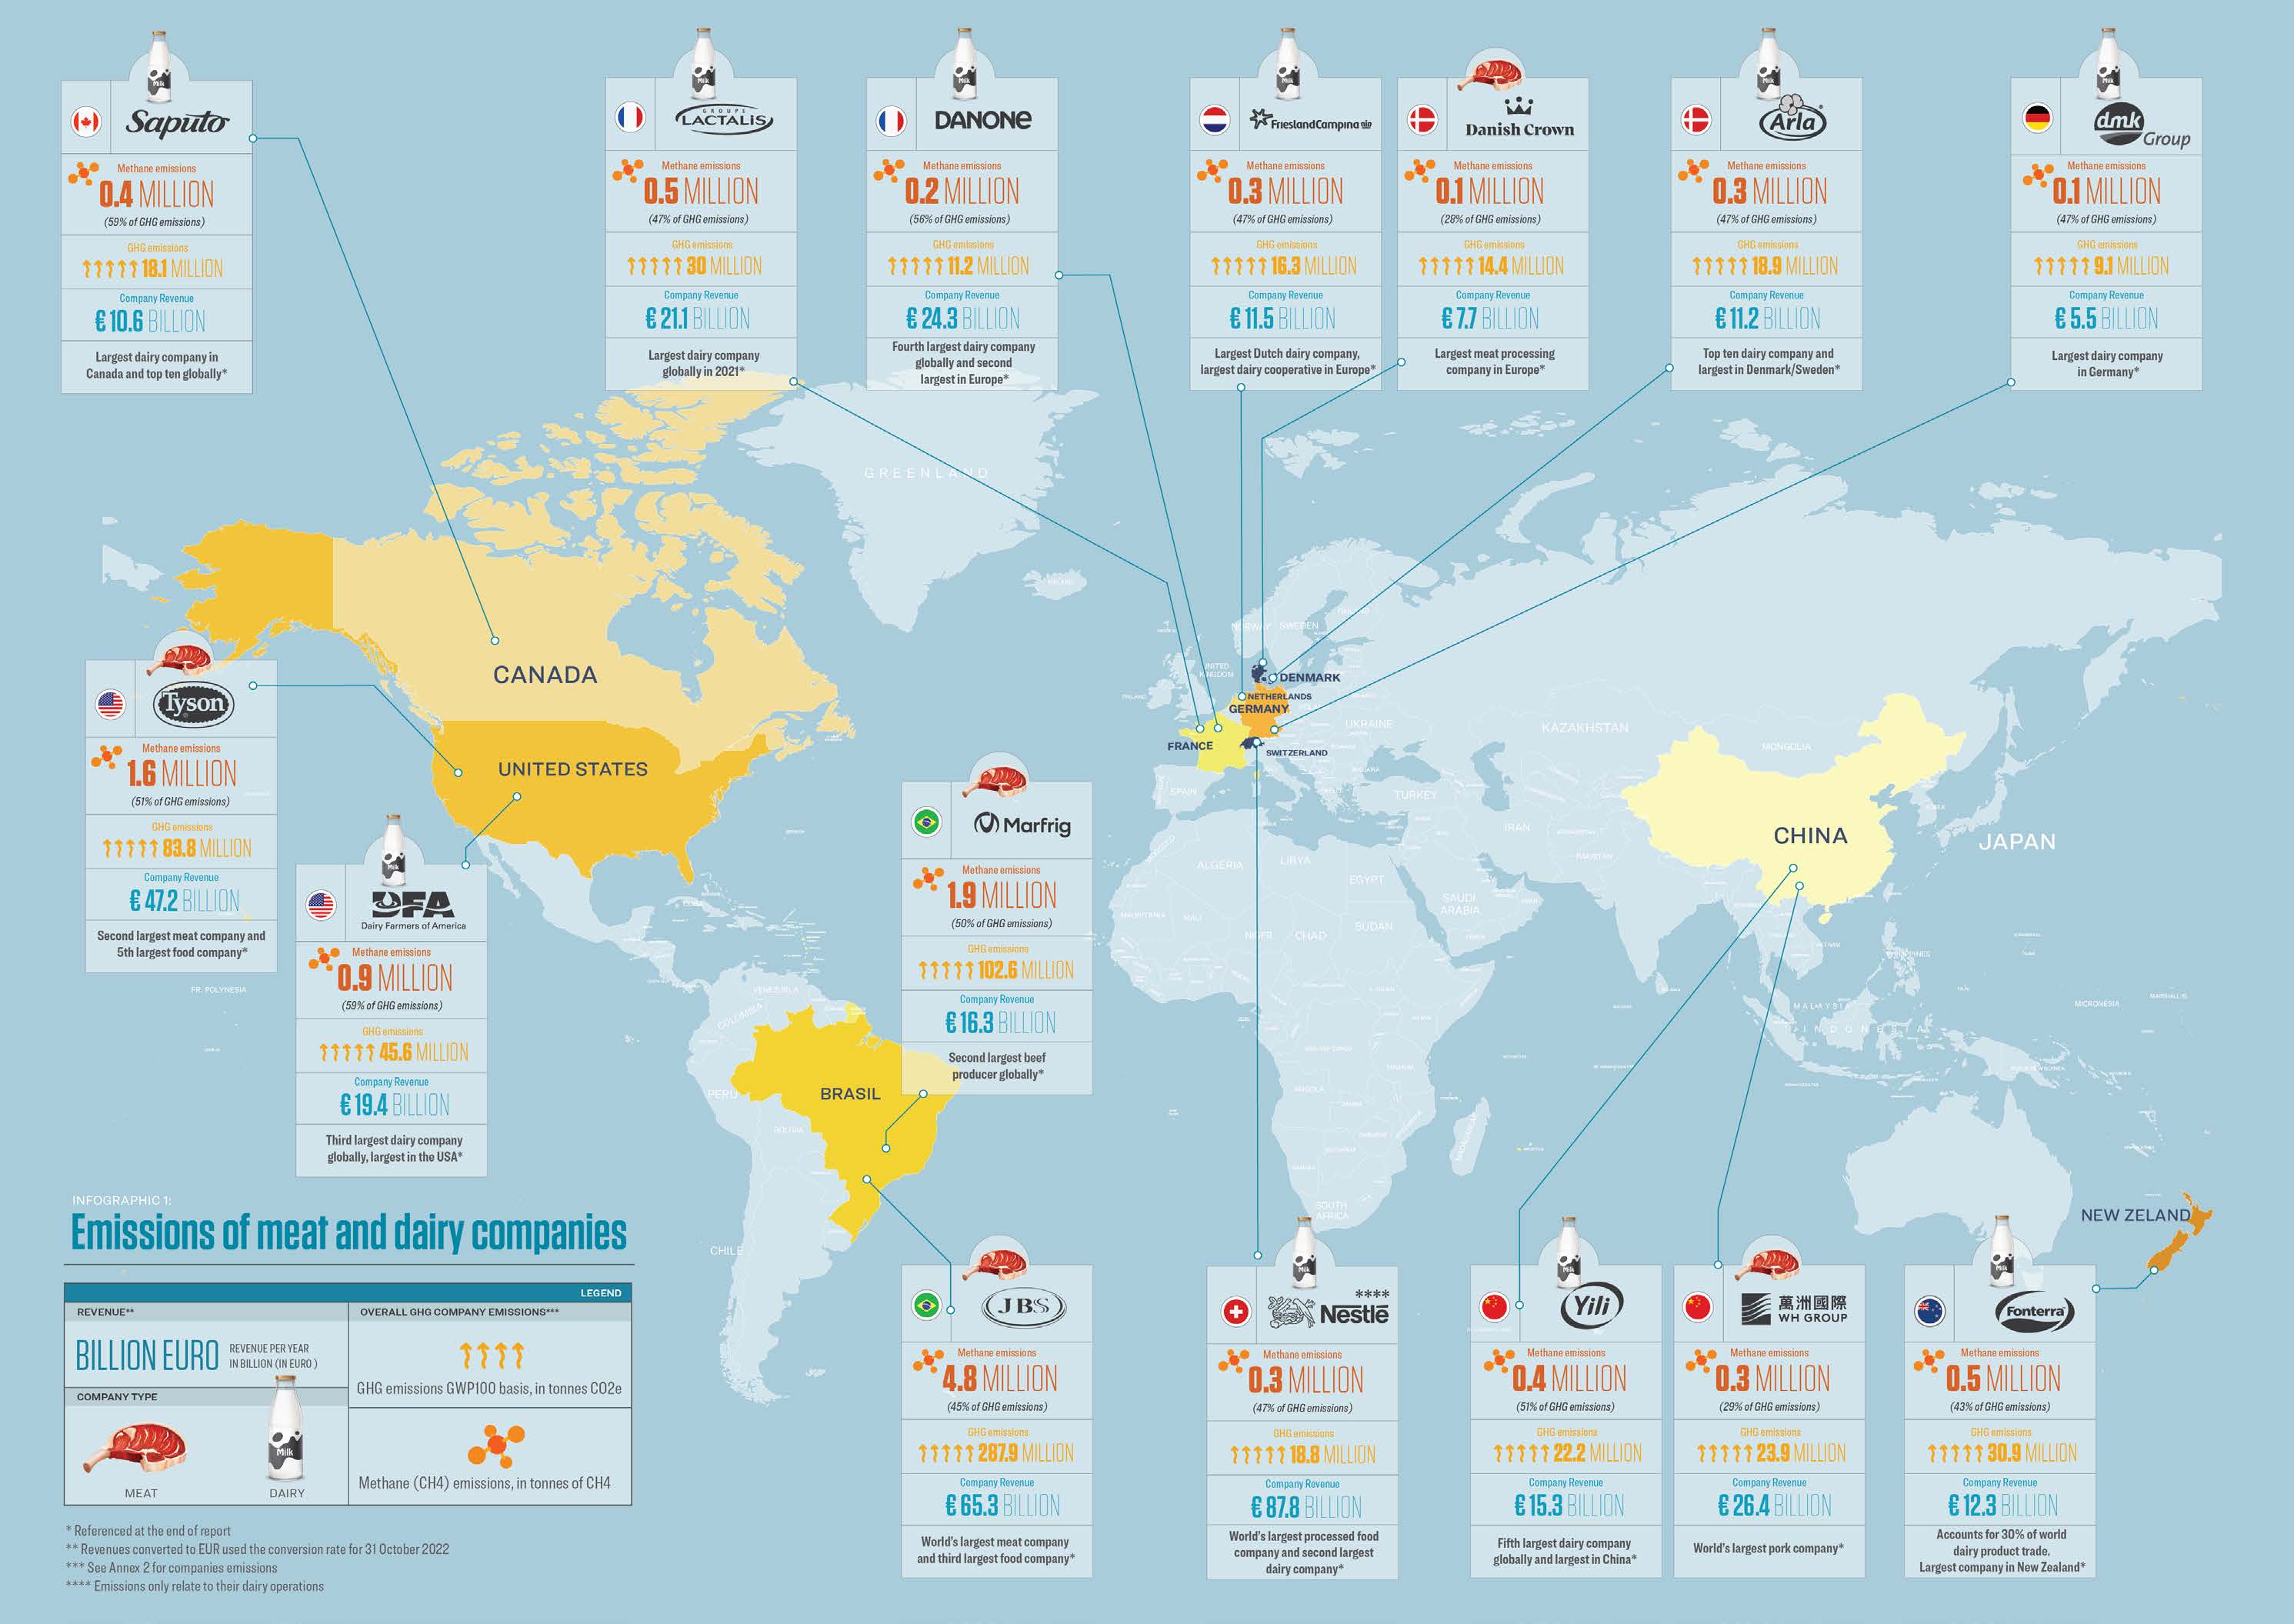
Our estimates show that the combined methane emissionsD of these 15 companies far exceed the entire methane footprint of many countries, including Russia, Canada, Australia or Germany (see Figure 2). The methane footprint of a country includes methane from three major methane-emitting sectors: fossil fuels, waste and agriculture. Total methane emissions from the 15 companies are equal, for instance, to 83% of the total methane emissions of the European Union.
We also compared these companies’ methane emissions with livestock-specific methane emissions from the EU and other countries. The US and the EU are some of the highest livestock methane emitters in the world. Figure 3 shows that the emissions of the 15 companies combined are 52% greater than the EU’s livestock-related methane emissions and 47% greater than those of the US. Without regulating the scale of these companies’ methane emissions, countries cannot realistically reduce their agricultural methane emissions in a meaningful manner.
It is also true that some of the EU and US livestock methane emissions come from these companies. However, these companies are multinationals with global operations, so their emissions also occur in other regions around the world. We compare company emissions to country emissions to illustrate the significant scale of these emissions as they relate to livestock-producing countries.
Methane emissions of individual companies are also comparable to livestock methane emissions from entire countries. Figure 4 shows that the methane emissions of JBS – the world’s largest meat processor – are the largest of any company, and larger than those of many countries. In fact, JBS’s methane footprint exceeds the combined livestock emissions of France, Germany, Canada and New Zealand. They amount to 55% of livestock emissions in the US. Marfrig’s emissions are in the same range as the livestock emissions of Australia, while Tyson’s emissions are roughly comparable to the Russian Federation. The largest-emitting dairy company, the Dairy Farmers of America, produces emissions comparable to the UK’s livestock emissions. Even the German company DMK, which was the smallest dairy producer analysed, has methane emissions similar to those of Austria.
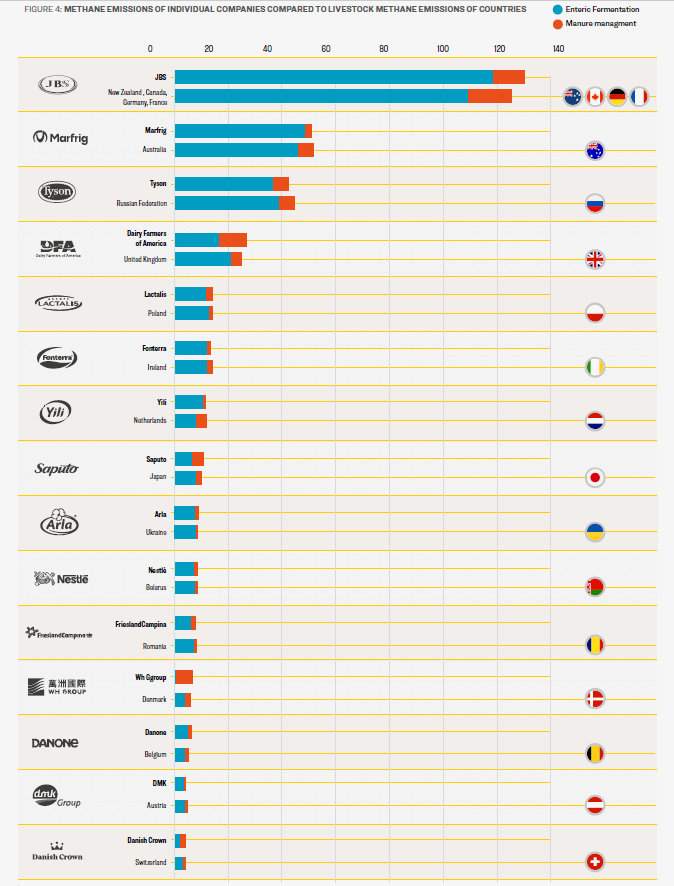
Sources: Meat and dairy companies: calculated by Changing Markets and IATP (2020–1); Regions: UNFCC greenhouse gas inventory (2020) https://di.unfccc.int
2.3 An urgent issue: The need to measure methane’s short-term climate impact
In its latest reports, the IPCC urged governments to rapidly cut GHG emissions, in particular methane, over this decade. The key reason is that the current trajectory of warming brings us ‘perilously close to tipping points that could lead to cascading and irreversible climate impacts’.21 To reduce this risk, science tells us we must focus on actions that reduce the rate of warming within 10 years. Within this timeframe, methane is 90-115 times more powerful than CO2,22 so methane reductions are our best tool to reduce the rate of warming and avoid tipping points. Given this context, the GWP20 emissions factor (warming impact over a 20-year time horizon) is a more relevant metric to compare the effectiveness of actions within this timeframe. For this reason, we use GWP20 alongside the more established GWP100 to estimate methane emissions of meat and dairy companies (see Box 2).
Box 2.1: Global warming potential(s) of methane emissions
Since every greenhouse gas traps heat in the atmosphere to a different degree, the concept of global warming potential (GWP) was developed to measure how much heat a given greenhouse gas traps in the atmosphere over a period of time compared to CO2. In essence, GWP measures how potent a gas is in its contribution to global temperature increase within a given timeframe.
CO2 is defined as having a GWP of 1. Because some gases are more persistent in the atmosphere than others, the relative contributions of different gases to warming changes over time. GWP metrics can compare the warming potential of gases over any time horizon; however, the 100-year time span – GWP100 – has been formally adopted as the metric for global warming potential in international climate policy. Most companies and countries therefore report their emissions using the GWP100 reference.
While CO2 stays in the atmosphere for thousands of years, methane only stays in the atmosphere for around a decade. However, methane is a much more potent greenhouse gas. Making decisions based only on the 100-year GWP of methane therefore understates the real dangers of short-term warming impacts. Rising emissions in the next ten years could unleash tipping points (large and possibly irreversible changes in response to environmental or anthropogenic disturbances once a certain critical threshold is reached), including the destabilisation of Arctic and West Antarctic icesheets.23 Several IPCC reports clearly state that we have until 2030 to prevent temperature overshoot.24 Given the urgency of the problem, we consider the 20-year time accounting frame as more relevant.25 For this reason, in addition to calculating emissions using GWP100, we have also calculated methane emissions using GWP20 to reflect the climate emergency and highlight the short-term benefit of methane reductions on slowing warming rates.
We have used GWP20 and GWP100 for non-fossil methane (see Table 1). These are the most up-to-date values according to the latest IPCC AR6 report. The small difference between fossil and non-fossil methane factors accounts for the fact that the CO2 for non-fossil sources was already present in the atmosphere and therefore is not additional, as it would be with the methane emitted from fossil sources (oil, gas and coal).26
Table 1: IPCC AR6 Factors for Methane Emissions
| |
GWP 20 |
GWP 100 |
| Non-fossil methane |
79.7 |
27.0 |
| Fossil methane |
82.5 |
29.8 |
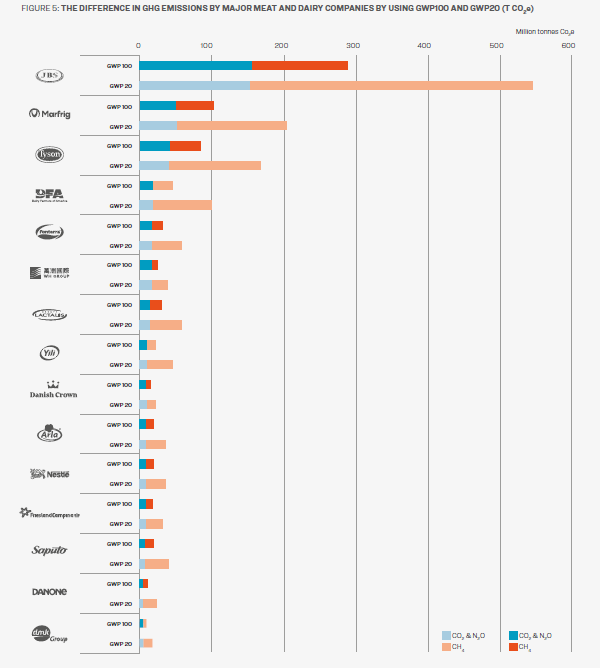
As illustrated in Figure 5, the emissions of meat and dairy companies become even more significant when methane is calculated for a 20-year time horizon to reflect the climate emergency. On a 20-year basis, one tonne of methane is equivalent to nearly three times more carbon dioxide than it is on a 100-year basis.
Applying the GWP20 metric almost doubles the companies’ emissions, when translated into CO2 equivalent (see Figure 5). For example, JBS’s total CO2 equivalent emissions rise from 287.9 million tonnes using GWP100 to 540.6 million tonnes using GWP20. The emissions of Marfrig, the second biggest emitter, nearly double from 102.6 million tonnes to 201.8 million tonnes. For the biggest dairy producer, Dairy Farmers of America, emissions go from roughly 45.6 million tonnes to 97.8 million tonnes of CO2 equivalent.
Methane represents a significant share of meat and dairy companies’ total estimated emissions linked to livestock production. Even over a 100 year time horizon, methane is a significant part of these companies overall greenhouse gas footprint. The combined methane emissions of the 15 companies constituted nearly half (47%) of these companies’ total emissions over a 100-year time horizon (GWP100). As illustrated in Figure 6, methane represents more than 40% of beef and dairy companies’ overall emissions over a 100-year time horizon, while for two companies that specialise in pork production (WH Group and Danish Crown) methane represents over 25% of emissions.
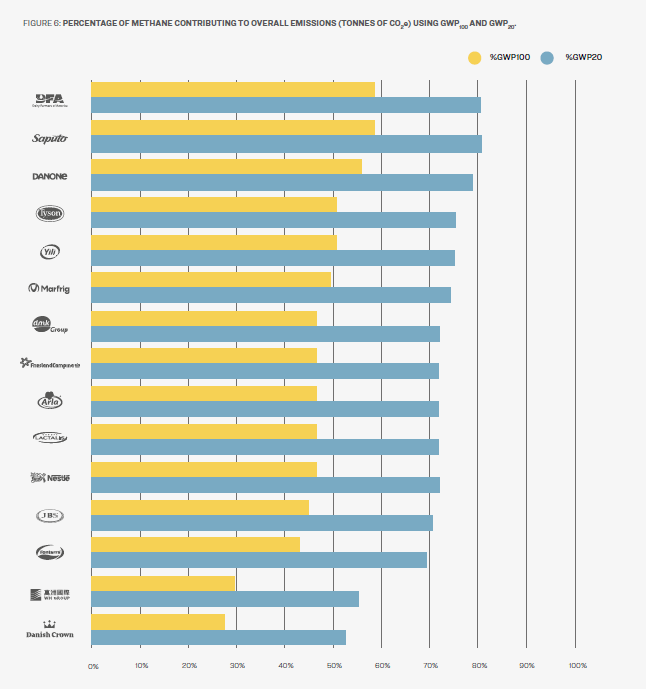
The share of methane in these companies’ total emissions becomes significantly higher when calculating the warming potential using a 20-year time horizon (GWP20), rising to 72% on average. For Canada’s Saputo and the US-based Dairy Farmers of America, methane constituted over 80% of total emissions, while pork producer Danish Crown’s methane emissions accounted for slightly over half its total emissions under a GWP20 estimate.
This highlights the need for companies to demonstrate how they will transition to a low methane pathway. It also underscores the need for these companies to separately report on all non-CO2 emissions stemming from their supply chain, such as methane, nitrous oxide and ammonia.
2.4 Carbon majors: Total GHG emissions of major meat and dairy companies rival countries and oil companies
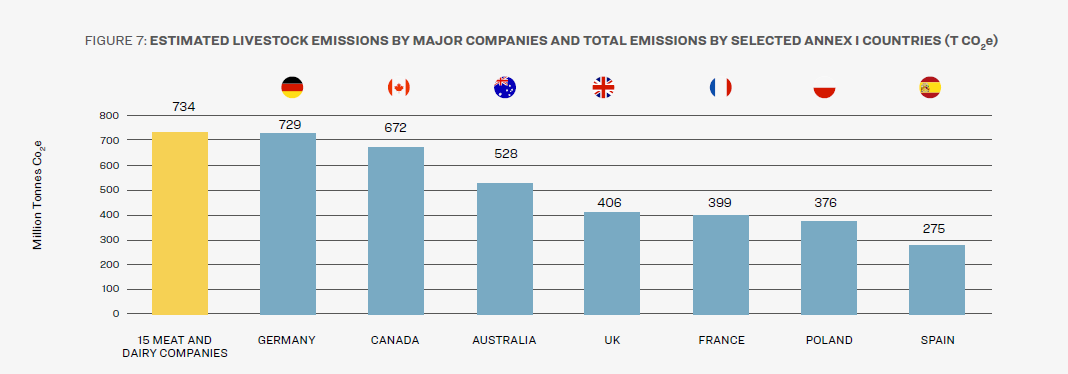
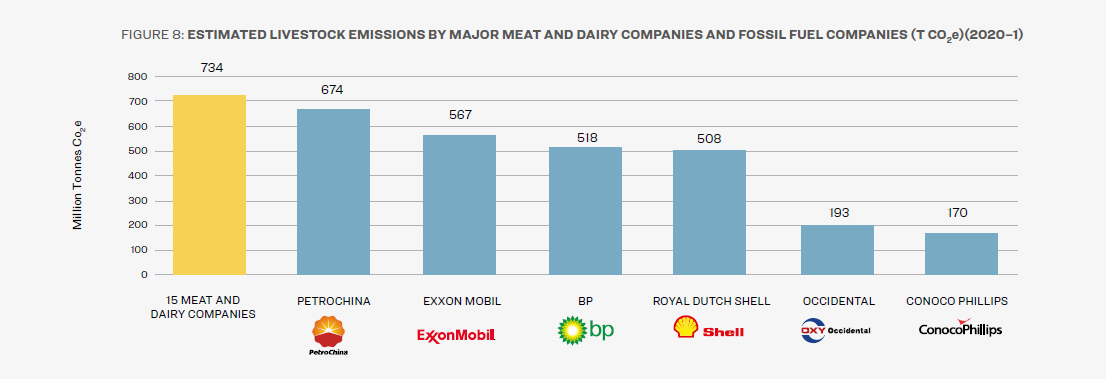
The 15 dairy and meat companies examined in this report produce a staggering quantity of emissions, amounting to approximately 734 million tonnes of CO2 equivalentE (Figure 7). This is roughly the same as the total GHG emissions (excluding land-use emissions) of Germany, the world’s fourth largest economy. Their emissions are more than those of Australia, Canada, the UK or France.27 In fact, if these 15 companies were treated as a country, they would be the tenth largest GHG emitting jurisdiction in the world.28 If we calculated their emissions using GWP20 factors, their emissions would go up to 1,408 million tonnes of CO2 equivalent.
One meat company alone, JBS, is responsible for nearly 40% of the estimated livestock emissions by these corporations. Its 287.9 million tonnes of CO2 emissions equivalent exceed the emissions of Spain (see Box 3).29
Credit: Shutterstock
Box 2.2: JBS, Marfrig and lack of transparency in the livestock industry
JBS is the world’s largest meat producer, earning a revenue of 65.3 billion EUR in 2021 (see Infographics 1). It ranked third out of the top 100 food and beverage companies by sales in 2021.30 Marfrig is the world’s second largest beef producer and the fifth biggest meat company by sales volume.31 Both are headquartered in Brazil with global operations. JBS has declared a net-zero climate target by 2040, ten years earlier than many of its counterparts. Like JBS, Marfrig has also ‘committed’ to a net-zero target, working with the Science-Based Targets initiative.32 Neither has published the actual number of animals it slaughtered in 2021. This makes it difficult to independently verify the claims they make on their emissions given that the number of animals they slaughter accounts for more than 90% of these companies’ supply chain emissions.
We estimate JBS’s 2021 GHG emissions as 287.9 million tonnes CO2 equivalent, and Marfrig’s as 102.6 million tonnes CO2 equivalent (GWP basis). See Annex 1 on our detailed methodology. Their emissions could be substantially higher – if both companies utilised 100% of their declared slaughter capacity 365 days a year, JBS’s livestock emissions could be as high as 383.3 million tonnes CO2 equivalent and Marfrig’s 136.3 million tonnes CO2 equivalent – or lower if their slaughter capacity utilisation is less than estimated. Narrowing this range would require the companies to be transparent about their operations. This includes revealing their complete slaughter figures from all the regions in which they operate. At a minimum, these companies should reveal the annual rate at which they use their slaughter capacity for all their meat products in all regions.
IATP and Changing Markets’ updated estimate for JBS’s absolute emissions is lower than the 421.6 million tonnes CO2 equivalent emissions that IATP, DeSmog and Feedback estimated in an April 2022 study.33 The discrepancy is due to three main factors:
- New science: We updated the estimates in this report based on new values that express the global warming potential of greenhouse gases compared to CO2 emissions factors, published in the IPCC’s Sixth Assessment Report (AR6).34 Using AR6 has had a significant impact on the overall emissions estimates because methane – produced in huge quantities by the livestock industry – is expressed in CO2 equivalents. For example, the current estimate of 287.9 million tonnes CO2 equivalent becomes 327.8 million tonnes CO2 equivalent if we use methane emissions factors from the IPCC Fifth Assessment Report (AR5), which were used in the April 2022 study.
- New information on slaughter numbers: The April 2022 estimate was based on “per day” figures published in JBS’s Institutional Presentation to investors.35 Since publishing this estimate, new JBS documentation36 has led us to conclude that this figure is not the number of animals that JBS slaughters but the number of animals its factories have the capacity to slaughter (its total processing capacity). In light of this new information, we have updated our estimates. We have done so by estimating the rate at which JBS uses its slaughter capacity based on publicly available information. For details, see our methodology in Annex 1.
- More conservative estimate of number of days which slaughterhouses are operational: Given the need to establish the rate at which JBS uses its slaughter capacity, we revisited how many days JBS plants might be in operation worldwide. No definitive information is available on the number of days JBS facilities are open per year, and conversations with trade unions and industry experts suggest a large amount of variation between countries and factories (with factories operational between five and seven days a week and holiday closures between six and eleven days a year). The April 2022 estimate assumes JBS facilities operate seven days a week with closures for eleven days of public holidays. Based on the additional research conducted for this study we have based the current estimate on a more conservative assumption that the company’s facilities operate six days a week with eleven holiday days per year. While the new estimate of JBS’s total emissions is lower than that published in April it does not change the fact that JBS is still the biggest polluter in the livestock sector – responsible for around 40% of the total emissions produced by the 15 companies assessed in this report – and that its emissions continue to increase at an alarming rate.F
Avoiding public scrutiny
Due to the endemic lack of transparency and a profound accountability vacuum in which these companies operate, independent estimates of livestock company emissions can only be understood as best-estimate benchmarks using available information. This is a critical reason why governments must require consistent and comprehensive emissions reporting and independent verification of these emissions. While reasonable assumptions on operational days and capacity utilisation can be adopted based on limited public information on livestock industry norms, only the companies themselves know how many animals they actually slaughter and how much meat they actually produce annually. Without a fundamental change in the disclosure requirements for these companies, public scrutiny of their livestock emissions will always be dependent on a combination of background research, new information and informed guesswork.
It is equally difficult to interpret these and other livestock companies’ climate claims and verify their reported emissions. For instance, JBS’s reported emissions change dramatically from its 2020 annual report to its 2021 report. In the 2020 report, JBS reported 588,523 tonnes CO2 equivalent for its scope 3 emissions.37 In the 2021 report, its 2020 emissions are reported as 61,121,337 tonnes CO2 equivalent38– a significant increase, but considerably lower than our revised estimate of JBS’s emissions. JBS states in its 2021 report that “data [was] altered in relation to previous years,”39 due to its expansion of scope 3 emissions monitoring. JBS clarifies that it does not yet include scope 3 emissions from livestock in its reporting, except for its European operations, but that this is ‘in progress’.40 While JBS has expanded the number of emission sources considered in its scope 3 reporting, it is difficult to draw any meaningful conclusions from its scope 3 reporting based on partial and inconsistent data and without full disclosure of emissions and animal processing data.
For this reason, we are calling for governments to require companies such as JBS to disclose animal slaughter data, their full scope of emissions and independent verification of all their climate reporting.
Sources: Meat and dairy companies: calculated by CMF and IATP; Countries: UNFCC greenhouse gas inventory, 2020 (excluding LULUCF): https://di.unfccc.int/time_series
While big oil and gas companies have been under sustained public pressure to reduce their emissions, meat and dairy companies have not received the same level of scrutiny despite their comparable emissions. The total livestock emissions estimates of the 15 meat and dairy companies combined exceed the emissions of major fossil fuel companies such as ExxonMobil, BP and Shell (see Figure 8).41 A number of fossil fuel companies are being taken to court over failures to implement emission reduction strategies in line with the Paris Agreement42,43 and for misleading consumers about the role their products play in causing climate change.44 When it comes to meat and dairy companies, however, we are aware of only one court case (Vegetarian Society et al. of Denmark vs. Danish Crown). It challenges the misleading marketing of pork products by meat giant Danish Crown as ‘climate controlled’.45
2.5 Uncounted and unaccountable: Companies fail to report their overall GHG and methane emissions
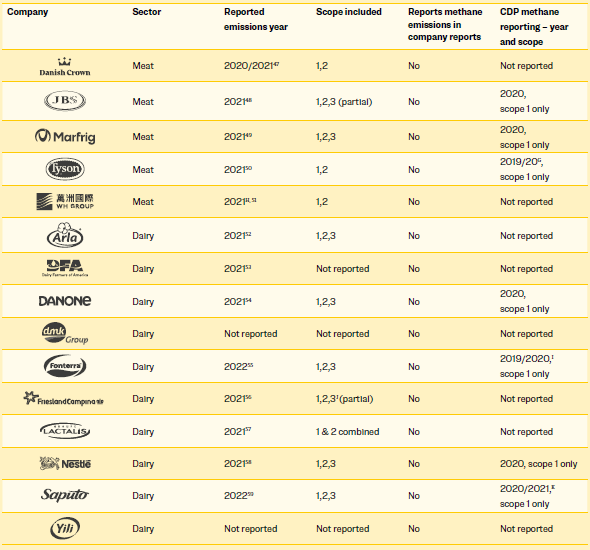
Like previous IATP and Changing Markets reports, this report finds a lack of corporate reporting both on total GHG emissions and, in particular, separate reporting of methane emissions. Nine out of 15 companies (60%) either do not report their emissions or do not report their total supply chain (scope 3) emissions. For companies in this sector, scope 3 could represent upwards of 90% of their total emissions.46 The majority of methane emissions also occur in scope 3. Three companies do not report their GHG emissions at all, while four only reported scope 1 and 2 emissions (see Table 2). Most of those that reported scope 1, 2 and 3 emissions are dairy companies.
Given the poor state of affairs in GHG reporting by livestock and dairy corporations, it should come as no surprise that corporations rarely if ever report their methane emissions. We found no evidence of methane reporting in companies’ most recent annual and sustainability reports. In corporate disclosures on the Carbon Disclosure Platform (CDP), seven companies (see Table 2) reported methane emissions, but only from their direct operations (scope 1). This means that they are leaving out significant emissions from farms and animals in their supply chains, resulting in vast underestimates of their actual methane footprint.
Sources: Meat and dairy companies: calculated by Changing Markets and IATP; Fossil fuel companies: Rick
Heede, Climate Accountability Institute, personal communication, 15 July 2022.
Table 2: Company reporting of overall GHG and methane emissions
SCOPE 1-3 Emissions Explained
Scope 1: Direct emissions from company-owned and controlled resources such as offices, processing plants and machinery. This could include use of natural gas or coal combustion and energy used in company transport; some companies may include emissions generated by animals’ digestive systems (enteric fermentation) at company-owned farms.
Scope 2: Indirect emissions generated from purchased electricity, heating and cooling consumed by the company.
Scope 3: Upstream and downstream supply chain emissions consisting of on-farm emissions from livestock, manure, farm machinery fuel, livestock feed production, production of inputs needed to produce that feed (e.g., nitrogen fertiliser), land-use changes triggered by the expansion of livestock grazing and feed production, and other sources.
If meat and dairy companies declare climate targets and ambitious net-zero plans, then the public must be able to verify these claims independently. The current state of the industry, let alone individual companies, is opaque and the best efforts to benchmark their emissions are met with resistance. This must change through enacting government regulations, not only on reporting requirements of emissions and animals in their supply chains, but also regulations on the minimum disclosure requirements companies must meet to make claims on emissions reductions and progress towards net-zero goals. This is underway in the US with proposed new rules by the Security and Exchange Commission (SEC) that would require companies to disclose scope 1 and 2 emissions by gas, including absolute emissions and offsets, and scope 3 if viewed as material. For any agriculture company, we believe scope 3 reporting should be required. The SEC is expected to finalise the proposed rules next year. The EU is working on a new directive on corporate sustainability due diligence and a proposal to regulate what companies can and cannot state to their consumers regarding carbon neutrality and green claims.60 This is a step in the right direction and must result in clear and enforceable rules to prevent corporate greenwashing globally. When it comes to methane, the EU also highlighted better reporting across all sectors as a priority measure in its methane strategy, published in 2020.61
Investors are also increasingly demanding this information. The Changing Markets Foundation’s survey of investors’ perceptions on climate impacts of the meat and dairy sector indicates that investors are concerned about the lack of action and reporting in the sector: 72% of investors said that reporting methane alongside carbon emissions was important, while 83% said that meat and dairy companies should be reducing their methane emissions.62
Finally, when companies do report emissions, existing audits and verification of these reports are often simply inadequate. In 2021, IATP’s Emissions Impossible Europe report found that only two companies headquartered in the EU out of the few that reported their emissions to CDP had their emissions verified.63 Even these two had ‘limited assurance’ audits. The level of assurance indicates the extent and depth of the work the assurance provider undertakes in relation to sustainability disclosures. Most assurance providers offer two levels: ‘reasonable’ (high, but still involving some risk of inappropriate conclusion) or ‘limited’. Limited assurance cannot provide a reasonable level of assurance due to limiting factors such as the size of a sample or sampling methods. JBS reported to the CDP that its 2021 scope 1 and 2 emissions were in the process of being verified,64 but it conducted no verification of its scope 3 emissions.
In summary, many livestock companies do not report their emissions or the number of animals in their supply chains. When they do, there is no independent and robust verification of these emissions. This must change for the industry to deliver real emissions cuts.
Credit: Shutterstock
Credit: Mika-Baumeister, Unsplash.com
3. Government inaction on industrial livestock threatens climate targets
3.1 Blindspot: Governments failing to address livestock methane
The Global Methane Assessment estimates that global methane emissions must be reduced by 40–45% by 2030 to achieve least-cost pathways that limit global warming to 1.5°C.65 Following the alarm raised by scientists, over 100 governments signed up to the Global Methane Pledge (‘the Pledge’), launched at COP26 in Glasgow in November 2021.66 Although the Pledge is a step in the right direction, it falls short of what the science says is needed: it commits its signatories to only 30% reductions by 2030 from a 2020 baseline as opposed to the 40–45% needed to prevent temperature overshoot.
Regulating the livestock industry’s methane footprint would critically help bridge that gap. Yet most of the 125 countries currently listed as participating in the Global Methane Pledge have not declared specific plans to deal with livestock methane. The Pledge itself is much weaker in addressing agriculture compared to other key sectors. For instance, the Pledge commits signatories to achieve ‘all feasible reductions’ in the energy and waste sectors. However, in relation to agriculture, it voices only vague commitments on ‘technology innovation as well as incentives and partnerships with farmers’.67 According to an investigative report by Unearthed, the American beef industry celebrated the fact that the sector emerged ‘relatively unscathed’ by the Pledge, according to statements at the National Cattlemen’s Beef Association (NCBA) annual conference.68 Tyson, a company analysed in this report, is a member of the NCBA product council.69
Total anthropogenic methane emissions were estimated to be around 380 million tonnes per year in 2017, from which the global livestock emissions were 115 million tonnes.70 Our research estimates that just 15 companies contribute 12.8 million tonnes of methane emissions a year. This represents 3.4% of total global anthropogenic methane emissions, or 11.1% of livestock emissions (enteric fermentation and manure combined). The biggest meat producer JBS alone is responsible for 4% of the total global livestock methane emissions. These numbers underscore the need to address livestock methane through legislation. Government regulation for large livestock methane emitters is long overdue and is urgently needed to increase the ambition of the Global Methane Pledge.
Table 3: Global methane emissions vs. emissions by selected companies (tonnes of methane)
| Global anthropogenic methane emissions (2017) |
380,000,000 |
| 15 meat and dairy companies |
12,789,000 (3.4%) |
| |
|
| Global livestock-related methane emissions (2017) |
115,000,000 |
| 15 meat and dairy companies |
12,789,000 (11.1%) |
3.2 Heading in the wrong direction: Methane emissions in milk and meat producing countries
This section analyses methane emissions reported to the United Nations Framework Convention on Climate Change (UNFCCC) from the ten major milk and meat producing countries where these companies are headquartered. These ten countries, with the exception of China, are all signatories to the Pledge. Our findings show that none of them achieved significant reductions in livestock methane emissions over the last decade (see Table 4). Even though there have been some improvements over the last five years, the pace of emission reductions is far too slow to meet the goals of the Pledge.
As can be seen from Table 4, the biggest livestock producing countries – the US, Brazil and China – have increased their livestock emissions over the last ten reported years. New Zealand and the Netherlands have also slightly increased their methane emissions, while Germany, Canada and Switzerland have slightly decreased theirs. The only country with a reported decrease of more than 5% over the last decade is France, the biggest livestock methane emitter in the EU. This shows that additional policies will be needed across the world to ensure that livestock methane emissions are rapidly reduced.
Below we review the most recent legislative initiatives by governments in the EU, US and New Zealand that aim to address livestock methane emissions. Our analysis shows that more action is needed to fill this gap.
Source: UNFCC greenhouse gas inventory, https://di.unfccc.int
3.3 Methane regulations: progress and gaps
3.3.1 European Union
The EU, together with the US, was one of the initiators of the Global Methane Pledge. Following the EU Methane Strategy in 2020, the European Commission has published a proposal for a Methane Regulation which intends to cut methane emissions from the energy sector. However, the energy sector represents only 13% of EU methane emissions, while livestock represents 53%.72
The Changing Markets Foundation commissioned a study from the environmental consultancy CE Delft which analysed the potential of different sectors in reducing methane emissions. The study, published in June 2022, warned that under the business-as-usual scenario the emissions from the livestock sector would decrease by only 3.7% by 2030, while the EU’s total methane emissions could be cut by up to 17% with existing and proposed policies.73 The EU is therefore not on track to achieve the reductions committed under the Pledge unless it adopts effective policies driving reductions from its biggest source – the livestock sector.74
The study also calculated the methane reduction potential of different measures the EU has at its disposal. The results showed that methane emissions could theoretically be cut by up to 68% if all mitigation measures across all sectors were implemented. The study highlights that the biggest cuts in methane could be achieved through policies that drive the uptake of healthier diets, aligned with the average national dietary health guidance. Just this one measure could cut the EU’s total methane emissions by 15–19% by 2030,75 though the EU would have to ensure that this reduction in meat and dairy consumption results in a fundamental change of the current intensive agriculture model and does not merely lead to increased exports.
Box 3.1: Case study: Netherlands proposes to cut livestock numbers due to nitrogen pollution
The Netherlands is one of the major EU milk and meat exporters with significant GHG and methane emissions from its huge livestock sector. It is also the headquarter of some of the biggest global meat and dairy corporations, such as Vion and FrieslandCampina. The Dutch government has become the first country in the EU to aim to reduce livestock numbers because of the industry’s outsized contribution to nitrogen pollution. This case study shows how livestock’s other pollutants are linked to action on methane and that a lack of early and sustained action to address pollution can lead to much more drastic measures later, with the risk of social upheaval.76
In May 2019, the Dutch High Court passed a decision that stalled the expansion of any projects that emit nitrogen. The shutdown put some €14 billion worth of projects in jeopardy, which included the expansion of pig, dairy and poultry farms – major sources of nitrogen in the form of ammonia from animal waste – as well as plans for new homes, roads and airport runways.77 Agriculture is the largest source of nitrogen emissions – responsible for nearly half of nitrogen pollution in the Netherlands. Technical measures, such as injecting liquid manure in the soil and installing air scrubbers on pig and poultry facilities, have reduced ammonia emissions by 60% since the 1980s, but they have risen again since 2014 because of expanding dairy operations.78 The government failed to address these emissions meaningfully until the court order. Following the verdict, the Court ordered the government to create a long-term plan to address nitrogen emissions.
The government’s plan is to halve nitrogen emissions by 2030. To do this it will have to cut livestock numbers by a third, which includes buying out farmers, for which the government has set aside around €25 billion.79 While NGOs and scientists have been urging the government to use the nitrogen crisis to transform agriculture, farmers have shown fierce opposition to the plan. Since the plan was presented in June, they have been blocking roads, airports and train stations and have even dumped slurry on the home of the minister in charge of the programme. The Politico reported that the agriculture Minister Henk Staghouwer resigned after he failed to convince the farmers to get on board with the programme.80
If the planned reduction in livestock numbers is achieved, this will also lead to a reduction in methane emissions. However, had the government acted earlier and developed a just transition plan together with the farmers, the social backlash could have perhaps been avoided. A massive transition from large-scale animal agriculture is required to move towards climate-resilient agricultural systems and healthier diets; however, for this to succeed, governments must plan and sequence the transition in a timely fashion.
3.3.2 United States
Methane accounts for 11% of US GHG emissions.81 Overall US methane emissions have declined 15% since 1990, with energy-related emissions declining by 25% since 1990 and industrial waste methane emissions declining by 31%.82 But the largest source of US methane emissions is agriculture and these emissions have increased by 17% since 1990.83 Agriculture now represents 37% of all US methane emissions. Livestock-related methane has risen even more – by 20% since 1990. IATP analysed the Biden methane reduction plan and concluded that large-scale industrial animal agriculture, also known as the factory-farm system, has largely evaded scrutiny.84 The reluctance to place appropriate limits on methane emissions from the biggest operations and halt the numerous public payouts that prop up the industry threatens to undermine the credibility of the Biden methane reduction commitment.
For agriculture, the Biden plan focuses on 1) ‘alternative manure management systems’; 2) the ‘expansion of on-farm generation and use of renewable energy systems’; 3) the ‘development of a climate smart agricultural commodities partnership initiative’; and 4) ‘increased investments in agricultural methane quantification’.85
All four agriculture strategies are tied to the controversial use of anaerobic digesters to capture factory-farm gas from giant manure lagoons at large-scale dairy, beef and pig operations (see Box 6 below).
3.3.3 New Zealand
Few countries are as dependent on the production and export of dairy and meat products as New Zealand, where the agriculture sector contributes around half of GHG emissions.96 More than 88% of methane emissions in New Zealand are from livestock production.97 Around 90% of the milk in New Zealand is produced by the industry giant Fonterra, the world’s largest exporter of milk products.98 While there has long been a debate about how to address methane emissions from livestock, no meaningful legislative measures have been taken due to the powerful opposition of the farm lobby. The agricultural methane emissions in New Zealand have increased by more than 3% in the last decade the government reported to the UNFCCC (see Table 4).99
The latest attempt to address agricultural emissions was a partnership between the government and the agroindustry whereby the industry had to propose its own emissions mitigation system.100 According to the Guardian, the government has accepted most of the recommendations from the partnership, but has rejected a proposal that farmers would set their own emissions prices. The price will now be influenced by the country’s progress towards meeting its target to cut methane by 10% by 2030.101 It is worth noting that this target does not bring New Zealand’s methane reduction in line with its commitment under the Pledge.
Box 3.2: Factory-farm gas as ‘renewable’ energy?
In the US, government and private sector efforts to reduce GHG emissions overall and methane emissions specifically have brought increased carbon offset schemes and legislation, such as California’s clean fuel standard. This is driving the proliferation of biodigesters.
Manure from large-scale animal agriculture can be pumped into anaerobic biogas digesters and converted into gas for heat, fuel and electricity. The state of California, for instance, has invested over $350 million into this technology for large-scale dairy farms.86 A quantity of the massive amounts of manure such large-scale farms produce is converted into gas. What remains is digestate – the leftover sludge which when exposed to air emits the greenhouse gas nitrous oxide and other pollutants such as ammonia and nitrates that leach into the soil and water when applied as fertiliser on fields. Emerging science and past research in major livestock-producing areas in Denmark, Canada and other US states is prompting scientists to demand further studies on the impact of digestor technology on the increase of ammonia emissions.87 High levels of ammonia severely impact air quality, making it dangerous for humans to breathe in the particulate matter it generates. New science is also suggesting that biogas production and distribution results in methane along the supply chain and that ‘a thorough understanding of where, when, and how much CH4 [methane] is released remains absent.’88 The scientists contend that ‘large quantities of CH4 can still be emitted from the biomethane and biogas supply chains, including digestate handling, anaerobic digesters, upgrading units, feedstock storages and transmission, and storage and distribution stages.’ 89
Biogas or biomethane is also referred to as ‘factory farmed gas’ by civil society organisations that challenge the notion that gas from large-scale animal agriculture operations is renewable.
Yet many of the companies in this report are turning towards and ramping up these approaches to meet their climate targets. For instance, Marfrig claims that the use of this gas as fuel helps the company to reduce its scope 1 emissions.90 Through its US subsidiary Smithfield, the world’s largest pork producer, the WH Group, launched the ‘Smithfield Renewables’ platform in 2017, the ‘hallmark’ of which is converting manure to energy.91 The company’s aim is ‘to reduce absolute GHG emissions across our entire U.S. value chain 25% by 2025, 30% by 2030 and to become carbon negative in our U.S. company-owned operations by 2030.’92 Smithfield has come under fire in the US state of North Carolina where its pig farms are mainly situated in low-income communities and communities of colour, leading to several lawsuits filed and won by the community.93 The US Environmental Protection Agency is investigating whether North Carolina’s approval of biogas digestors violates the civil rights of rural neighbours.94 In the meantime, Smithfield is expanding this approach in other states and also partnering with utility companies to sell this gas as renewable energy, including in North Carolina.95
The promotion of biogas digestors is a band aid on a much larger set of environmental and social problems emanating from factory farms. They do little to support the transition towards lower animal numbers in agriculture and could perversely incentivise the expansion of such a system.
Credit: Clynt Garnham, Agriculture/Alamy Stock Photo
4. Conclusions and recommendations
The five meat and ten dairy companies analysed in this report are responsible for 12.8 million tonnes of methane emissions annually. This represents around 3.4% of all global anthropogenic methane emissions and 11.1% of the world’s livestock-related methane (enteric fermentation and manure combined). That just 15 transnational livestock corporations’ methane footprint is so significant should be a wake-up call for governments and intergovernmental organizations. It should catalyse urgent governmental action to regulate these actors, obliging them to cut methane emissions to prevent temperature overshoot.
The need to target the livestock industry’s methane footprint becomes even more pressing when these emissions are calculated over a 20-year timeframe (GWP20). In line with the latest science, this is the appropriate metric to reflect the scale of climate action needed to address the unfolding climate emergency. Methane comes to represent 72% of meat and dairy companies’ total emissions when calculated over a 20-year timeframe.
Time is of the essence. Yet most of the 125 countries listed as participating in the Global Methane Pledge, including nine meat and dairy production powerhouses analysed in the report, have not declared specific or robust plans to deal with livestock methane. Policymakers have identified solutions that tinker around the edges of this extractive system of animal agriculture, limited to techno fixes without serious consideration of systemic transformations needed in the production, trade and consumption of livestock products. Acting on livestock methane requires a holistic understanding of the drivers of mass industrial animal production and multiple policy interventions to reduce the number of animals used for meat and dairy production.
Methane is not the only problem linked with these concentrated agro-industrial systems. Just 15 dairy and meat companies examined in this report also produce a staggering quantity of overall GHG emissions, amounting to approximately 734 million tonnes of CO2 equivalent per yearL (Figure 8). This is larger than the total GHG emissionsM of Germany, the world’s fourth largest economy. There is no time to lose to set a transition in motion.
The Changing Markets Foundation’s report Blindspot, published in 2021, showed the disturbing lack of action by big meat and dairy companies to address climate and methane emissions through their voluntary initiatives.102 The 15 companies analysed in this report reported revenues of more than €382 billion in 2021, more than the entire GDP of countries such as Norway. Their significant profits are not being invested in transformative solutions to address the climate emergency. Yet governments cannot expect these powerful corporations to voluntarily change their model of mass industrial animal agriculture.
Governments must lead in facilitating such a transition: Regulating the livestock industry’s numerous environ- mental and social impacts and ensuring that these companies do not transfer all the risks of the transition onto farmers. Farmers within and outside these corporate supply chains have a critical role to play in a sequenced, deliberate and just transition out of mass industrial livestock production towards livestock-raising systems that are healthy for the planet and people.
Another shocking finding of this fourth report in the Emissions Impossible series is the lack of significant changes in the governance of corporate livestock reporting and verification. Four years since the release of IATP and GRAIN’s first Emissions Impossible report, publicly available data on corporate emissions remains incomplete, not comparable between companies or years and, in the majority of cases, absent. None of the companies examined in this report disclose methane emissions from their supply chains. Only nine out of 15 companies report some level of their overall GHG emissions. Basic information for independent emissions calculations like annual production figures for meat and milk per region are either not published by companies or inconsistently reported over time.
In the absence of strong disclosure rules, voluntary climate targets and reporting are leading to pervasive levels of greenwashing. Meat industry corporations lag behind their dairy counterparts in terms of their climate reporting, but neither sector’s climate claims are subject to independent third-party verification. The few initiatives that exist, such as CDP or the Science Based Targets initiative, rely on corporate self-reporting with inadequate verification. Without mandatory reporting and robust independent verification, it is impossible to gauge whether corporate net-zero and other climate targets are even in the ballpark of limiting warming to 1.5°C. Potential new rules in the US and the EU for disclosure of emissions, climate risk and the prevention of greenwashing climate claims may be opportunities for change.
All of the governments where these companies are headquartered (with the exception of China) have signed up to the Pledge. They must significantly ramp up ambition to reduce methane from the livestock industry. Our findings show that a comprehensive set of regulations is needed to ensure that the burden for emissions reduction rests on corporations that shape and drive the supply chain and that rules are needed to prevent corporations from merely passing on the risk to farmers. In global supply chains, these transnational corporations wield the most market and political power, while the farmers are the weakest link. Governments must have the political will to support farmers towards a just transition to agroecology that supports rural communities while helping mitigate and adapt to climate change.
4.1 Recommendations for governments:
- Set binding GHG and methane reduction targets for the agriculture sector in line with the global goal of limiting temperature increase to 1.5°C.
- Require companies to consistently and comprehensively report their GHG emissions, including scope 3, and set emission-reduction targets in line with science, including a system of independent third-party verification. Methane, nitrous oxide and CO2 emissions must be reported separately.
- Enact a phased and bottom-up transition for farms to reduce animal numbers in line with a just transition policy for the transformation of the animal agriculture sector.
- Regulate all pollutants (besides methane) from mass industrial livestock production to facilitate a transition from this model of animal agriculture towards agroecology.
- Reform agriculture policy (the Common Agricultural Policy, the Farm Bill, etc.) to support higher environmental and social outcomes and drive an agroecological transformation of the sector, away from mass industrial livestock production towards livestock systems that are healthy for the planet and people. This includes removing subsidies for mass production of feed grains and making farm support dependent on positive environmental and social outcomes.
4.2 Recommendations for companies:
- Set emissions reduction targets and action plans in line with the global goal of limiting temperature increase to 1.5°C. The focus must be on reducing the company’s absolute emissions, rather than emissions intensity, including scope 3 emissions. Companies should also include transparent reporting, including slaughter numbers and milk intake, to enable independent verification of their climate-related disclosures.
- Establish separate methane reduction targets and action plans to meet them, including separate reporting of methane emissions. Reporting should also include disclosure of investments in climate mitigation and adaptation measures.
- Reduce the number of animals in global supply chains and create a bottom-up just transition plan with farmers and workers in your global supply chains.
- Support progressive climate, environmental and health policies that will drive a shift to healthier and more environmentally sustainable diets.
7. References
Footnotes
A Highlighting global dairy corporations’ emissions in Milking the Planet (2020) (https://www.iatp.org/milking-planet) and emissions estimates of and greenwashing strategies used by over 20 livestock companies headquartered in Europe in Emissions Impossible Europe (2021) (https://www.iatp.org/emissions-impossible-europe).
B See Emissions Impossible methodology note, pp. 24-27 (https://www.iatp.org/emissions-impossible).
C At the time of finalising this report, FAO had begun posting partial updates to GLEAM, but we did not have regional emissions factors that would enable us to update these calculations.
D Unless otherwise specified, corporate methane emissions estimates in this report include methane from feed, enteric
fermentation and manure management, from dairy and meat processing operations only.
E This estimate was made using GWP100 for methane, as this enables comparisons.
F Depending on the precise use rate of JBS’ slaughterhouses worldwide which only JBS can confirm, the emissions change over five years (2016-2021) could range anywhere between 17-56% increase in emissions.
G Reporting year October 2019 – September 2020.
H First year reporting scope 1 and 2.
I Reporting year August 2019 – July 2020.
J States in its annual report: 'Greenhouse gas emissions, excluding purchase of green energy were: 1,131 kt CO2 equivalent (2021), 1,172 kt CO2 equivalent (2020) respectively. The basis for calculating the 2020 figure has been updated to be consistent with the Science Based Targets Initiative’s methodology and in accordance with FrieslandCampina’s greenhouse emission target for 2030.'
K Reporting year April 2020 – March 2021
L This estimate was made using GWP100 for methane, as this enables comparisons.
M Excluding land-use change.
Endnotes
1 IPCC (2022) Newsroom. [ONLINE] Available at: https://www.ipcc.ch/2022/04/04/ipcc-ar6-wgiii-pressrelease
2 Intergovernmental Panel on Climate Change (2013) Climate change 2013: The physical science basis. Contribution
of working group I to the fifth assessment report of the Intergovernmental Panel on Climate Change:
Anthropogenic and natural radiative forcing. p 714 [ONLINE] Available at: https://www.ipcc.ch/report/ar5/wg1/
here
3 UNEP (2021) Global Methane Assessment: Summary for decision makers. [ONLINE] Available at: https://wedocs.
unep.org/bitstream/handle/20.500.11822/35917/GMA_ES.pdf
4 UNEP (2021) Global Methane Assessment: Summary for decision makers.
5 Climate Watch (n.d.) Historical GHG emissions. [ONLINE] Available at: https://www.climatewatchdata.org/
ghg-emissions?end_year=2019&start_year=1990 Climate Watch (n.d.) Historical GHG emissions. [ONLINE] Available at: https://www.climatewatchdata.org/
ghg-emissions?end_year=2019&start_year=1990
6 IPCC (2022) Newsroom. [ONLINE] Available at: https://www.ipcc.ch/2022/04/04/ipcc-ar6-wgiii-pressrelease
7 IPCC (2022) Summary for Policymakers. In: Climate Change 2022: Mitigation of Climate Change. Contribution
of Working Group III to the Sixth Assessment Report of the Intergovernmental Panel on Climate Change [P.R.
Shukla, J. Skea, R. Slade, A. Al Khourdajie, R. van Diemen, D. McCollum, M. Pathak, S. Some, P. Vyas, R. Fradera,
M. Belkacemi, A. Hasija, G. Lisboa, S. Luz, J. Malley, (eds.)]. Cambridge University Press, Cambridge, UK and
New York, NY, USA. doi: 10.1017/9781009157926.00, Para C.2, pg. 27 [ONLINE] Available at: https://www.ipcc.
ch/report/ar6/wg3/downloads/report/IPCC_AR6_WGIII_SPM.pdf
8 Climate and Clean Air Coalition (n.d.) Methane [ONLINE] Available at: https://www.ccacoalition.org/en/slcps/
methane
9 Voiland, A. (2020) Methane emissions continue to rise. NASA, 14 July 2020. [ONLINE] Available at: https://
earthobservatory.nasa.gov/images/146978/methane-emissions-continue-to-rise
10 Jackson, R. B., Saunois, M., Bousquet, P., Canadell, J. G., Poulter, B., Stavert, A. R., Bergamaschi, P., Niwa, Y.,
Segers, A. and Tsuruta, A. (2020) Increasing anthropogenic methane emissions arise equally from agricultural
and fossil fuel sources. Environmental Research Letters, 15(7): 071002. [ONLINE] Available at: https://iopscience.
iop.org/article/10.1088/1748-9326/ab9ed2
11 Xu, X., Sharma, P., Shu, S., Lin, T.-S., Ciais, P., Tubiello, F.N., Smith, P., Campbell, N. and Jain, A.K. (2021) Global
greenhouse gas emissions from animal-based foods are twice those of plant-based foods. Nature Food 2:
724–732. [ONLINE] Available at: https://doi.org/10.1038/s43016-021-00358-x
12 Clark, M.A., Domingo, N.G.G., Colgan, K., Thakrar, S.K., Tilman, D., Lynch, J., Azevedo, I.L. and Hill, J.D. (2020)
Global food system emissions could preclude achieving the 1.5° and 2°C climate change targets. Science
370(6517): 705-708. [ONLINE] Available at: https://www.science.org/doi/full/10.1126/science.aba7357
13 IATP and GRAIN (2018) Emissions impossible: How big meat and dairy are heating up the planet. [ONLINE]
Available at: https://www.iatp.org/emissions-impossible
14 IATP and GRAIN (2018) Emissions impossible: How big meat and dairy are heating up the planet.
15 IATP and GRAIN (2018) Emissions impossible: How big meat and dairy are heating up the planet. p.5
16 IFCN (2021) Press release: Top Dairy Processors commit to climate goals and show strong performance in
challenging times. [ONLINE] Available at: https://ifcndairy.org/top-dairy-processors-commit-to-climate-goals
17 Voiland, A. (2020) Methane emissions continue to rise. NASA, 14 July 2020.
18 Höglund-Isaksson, L., Gómez-Sanabria, A., Klimont, Z., Rfaj, P. and Schöpp, W.(2020) Technical potentials and
costs for reducing global anthropogenic methane emissions in the 2050 timeframe –results from the GAINS
model. Environmental Research Communications, 2(2): 025004 [ONLINE] Available at: https://iopscience.iop.
org/article/10.1088/2515-7620/ab7457/meta
19 Jackson, R. B., Saunois, M., Bousquet, P., Canadell, J. G., Poulter, B., Stavert, A. R., Bergamaschi, P., Niwa, Y.,
Segers, A. and Tsuruta, A. (2020) Increasing anthropogenic methane emissions arise equally from agricultural
and fossil fuel sources. Environmental Research Letters, 15(7): 071002. [ONLINE] Available at https://iopscience.
iop.org/article/10.1088/1748-9326/ab9ed2
20 ERCE (2021) IPCC Sixth Assessment Report Global Warming Potentials. [ONLINE] Available at: https://www.
ercevolution.energy/ipcc-sixth-assessment-report
21 United Nations (2022) Statements. [ONLINE] Available at: https://www.un.org/sg/en/content/sg/statement/
2022-04-04/secretary-generals-video-message-the-launch-of-the-third-ipcc-report-scroll-down-forlanguages
22 Balcombe et.al (2018) Methane emissions: choosing the right climate metric and time horizon. [ONLINE]
Available at: https://doi.org/10.1039/C8EM00414E
23 Wunderling, N. (2021) Interacting tipping elements increase risk of climate domino effects under global
warming. Earth System Dynamics, 12, 601–619. [ONLINE] Available at: https://esd.copernicus.org/articles/
12/601/2021
24 Masson-Delmotte, V., P. Zhai, H.-O. Pörtner, D. Roberts, J. Skea, P.R. Shukla, A. Pirani, W. Moufouma-Okia, C.
Péan, R. Pidcock, S. Connors, J.B.R. Matthews, Y. Chen, X. Zhou, M.I. Gomis, E. Lonnoy, T. Maycock, M. Tignor,
and T. Waterfield (eds.)]. (2022) IPCC Summary for Policymakers. In: Global Warming of 1.5°C. An IPCC Special
Report on the impacts of global warming of 1.5°C above pre-industrial levels and related global greenhouse gas
emission pathways, in the context of strengthening the global response to the threat of climate change, sustainable
development, and efforts to eradicate poverty. Cambridge University Press, Cambridge, UK and New York,
NY, USA, pp. 3-24. [ONLINE] Available at: https://doi.org/10.1017/9781009157940.001
25 Shindell, D., Borgford-Parnell, N., Brauer, M., Haines, A., Kuylenstierna, J.C.A., Leonard, S.A., Ramanathan,
V., Ravishankara, A., Amann, M. and Srivastava, L. (2017) A climate policy pathway for near- and long-term benefits.
Science 356(6337): 493-494. [ONLINE] Available at: https://www.science.org/doi/abs/10.1126/science.
aak9521
26 Forster, P., Storelvmo, T.,Armour, K., Collins, W., Dufresne, J.-L., Frame, D., Lunt, D.J., Mauritsen, T., Palmer,
M.D.,. Watanabe, M., Wild, M. and Zhang, H. (2021) The Earth’s Energy Budget, Climate Feedbacks, and
Climate Sensitivity. In: Climate Change 2021: The Physical Science Basis. Contribution of Working Group I to the
Sixth Assessment Report of the Intergovernmental Panel on Climate Change [V.,Masson-Delmotte, P. Zhai, A.
Pirani, S.L. Connors, C. Péan, S. Berger, N. Caud, Y. Chen, L. Goldfarb, M.I. Gomis, M. Huang, K. Leitzell, E. Lonnoy, J.B.R. Matthews, T.K. Maycock, T. Waterfield, O. Yelekçi, R. Yu, and B. Zhou (eds.)]. Cambridge University
Press, Cambridge, UK and New York, NY, USA, pp. 923–1054. [ONLINE] Available at: https://report.ipcc.ch/
ar6wg1/pdf/IPCC_AR6_WGI_Chapter_07.pdf
27 UNFCC (2022) Time series. [ONLINE] Available at: https://di.unfccc.int/time_series
28 Climate Watch (n.d.) Historical GHG emissions. [ONLINE] Available at: https://www.climatewatchdata.org/
ghg-emissions?end_year=2019&start_year=1990
29 UNFCC (2022) Time series. [ONLINE] Available at: https://di.unfccc.int/time_series
30 Food engineering (2021). 2021 Top 100 Food & Beverage Companies. [ONLINE] Available at: https://www.
foodengineeringmag.com/2021-top-100-food-beverage-companies
31 Food engineering (2021). 2021 Top 100 Food & Beverage Companies.
32 Science-Based Targets (n.d.) Companies taking action. [ONLINE] Available at: https://sciencebasedtargets.org/
companies-taking-action
33 DeSmog, IATP, Feedback (2022) World’s largest meat company, JBS, increases emissions by 51% in five years
despite 2040 net zero climate target, continues to greenwash its huge climate footprint. [ONLINE] Available at:
https://www.iatp.org/media-brief-jbs-increases-emissions-51-percent
34 Forster, P., T. Storelvmo, K. Armour, W. Collins, J.-L. Dufresne, D. Frame, D.J. Lunt, T. Mauritsen, M.D. Palmer, M.
Watanabe, M. Wild, and H. Zhang, 2021: The Earth’s Energy Budget, Climate Feedbacks, and Climate Sensitivity.
Table 7.15., p.1017.
35 JBS (2021) Institutional presentation, including 4Q21 and 2021 results. [ONLINE] Available at: https://api.
mziq.com/mzfilemanager/v2/d/043a77e1-0127-4502-bc5b-21427b991b22/89617df2-cf31-77d8-d102-
c2dee83873fb?origin=1
36 Pereira, H (2022) Technical Opinion: Critical evaluation of the methodology adopted in the IATP (Institute
for Agriculture and Trade Policy) study to estimate JBS’ GHG emissions. WayCarbon, Version 1.0, July 2022.
[ONLINE] Available at: https://jbs.com.br/wp-content/uploads/2022/08/-jbs-technical-note-iatp-eng.pdf
37 JBS (2020). Sustainability report: Environmental, Social and Governance. Page 43 [ONLINE] Available at:
https://jbs.com.br/wp-content/uploads/2021/08/-sustainability-in-report-jbs-2020.pdf
38 JBS (2021) Annual sustainability report. Page 19 [ONLINE] Available at: https://api.mziq.com/mzfilemanager/
v2/d/043a77e1-0127-4502-bc5b-21427b991b22/ae88aaaa-6925-b917-b021-7755ffd07729?origin=1
39 JBS (2021) Annual sustainability report. Page 19 [ONLINE] Available at: https://api.mziq.com/mzfilemanager/
v2/d/043a77e1-0127-4502-bc5b-21427b991b22/ae88aaaa-6925-b917-b021-7755ffd07729?origin=1
40 JBS (2021) Annual sustainability report. Page 65 [ONLINE] Available at: https://api.mziq.com/mzfilemanager/
v2/d/043a77e1-0127-4502-bc5b-21427b991b22/ae88aaaa-6925-b917-b021-7755ffd07729?origin=1
41 R. Heede, Climate Accountability Institute, personal communication, 15 July 2022
42 Meredith, S. (2022) Shell’s board of directors sued for ‘failing to properly prepare’ for the energy transition.
CNBC, 15 March 2022 [ONLINE] Available at: https://www.cnbc.com/2022/03/15/oil-shell-directors-sued-forfailing-
to-prepare-for-energy-transition.html
43 Jessop, S., Dickie, G. and Mallet, B. (2022) Environmental groups sue TotalEnergies over climate marketing
claims. Reuters, 3 March 2022. [ONLINE] Available at: https://www.reuters.com/business/sustainable-business/
environmental-groups-sue-totalenergies-over-climate-marketing-claims-2022-03-03
44 Morrow, S. (2020) 5 major oil firms sued for causing climate change. AA Energy, 26 June 2020. [ONLINE]
Available at: https://www.aa.com.tr/en/energy/oil/5-major-oil-firms-sued-for-causing-climate-change/29705
45 Climate Change Litigation Databases. Vegetarian Society et al. of Denmark v Danish Crown. [ONLINE] Available
at: http://climatecasechart.com/non-us-case/vegetarian-society-et-al-of-denmark-v-danish-crown
46 IATP (2021) Emissions Impossible Europe. [ONLINE] Available at: https://www.iatp.org/emissions-impossible-
europe
47 Danish Crown (2021) Sustainability report. [ONLINE] Available at: https://www.danishcrown.com/media/
9870/2020-2021_sustainability-report.pdf; Accessed 23 September 2022
48 JBS (2021) Annual sustainability report. [ONLINE] Available at: https://jbs.com.br/wp-content/uploads/
2022/08/-sustainability-in-report-jbs-2021.pdf; Accessed 23 September 2022
49 Marfrig (2021) Sustainability report. [ONLINE] Available at: https://api.mziq.com/mzfilemanager/v2/d/
b8180300-b881-4e6c-b970-12ad72a86ec8/123486e8-e4e3-2085-b073-7a9781f8224f?origin=2
50 Tyson (2021) The formula to feed future: 2021 Sustainability report. [ONLINE] Available at: https://www.tysonsustainability.
com/downloads/Tyson_2021_Sustainability_Report.pdf; Accessed 23 September 2022
51 WH Group (2021). Environmental, Social and Governance report. [ONLINE] Available at: http://media-whgroup.
todayir.com/202205300946301779088976_en.pdf
52 Arla (2021) Building sustainable solutions: 2021 Sustainability report. [ONLINE] Available at: https://www.arla.
com/492cbb/globalassets/pdf-files/sustainability-report-2021/sustainability-report-2021.pdf
53 Dairy Farmers of America (2021) 2021 Social responsibility report. [ONLINE] Available at: https://issuu.com/
dairyfarmersofamerica/docs/sust21003_srr_r9_pg
54 Danone (2021) Exhaustive 2021 Extra- Financial Data: Exhaustive Environmental data. [ONLINE] Available
at: https://www.danone.com/content/dam/danone-corp/danone-com/investors/en-sustainability/reports-
and-data/planet/danone2021environmentaldatav2.pdf
55 Fonterra (2022) Good together from one generation to the next: Sustainability report. [ONLINE] Available at:
https://view.publitas.com/fonterra/2022-sustainability-report/page/1
56 FrieslandCampina (2021) 150 years: A nourishing company, 2021 Sustainability report. [ONLINE] Available at:
https://www.frieslandcampina.com/uploads/2022/06/FrieslandCampina-Annual-Report-2021.pdf
57 Lactalis (2021) 2021 CSR report. [ONLINE] Available at: https://www.lactalisingredients.com/wp-content/uploads/
2022/08/LACTALIS-INGREDIENTS-Report_EN_2021.pdf
58 Nestlé (2021) Creating Shared Value and Sustainability Report 2021: We unlock the power of food to enhance
quality of life for everyone, today and for generations to come. [ONLINE] Available at: https://www.nestle.com/
sites/default/files/2022-03/creating-shared-value-sustainability-report-2021-en.pdf
59 Saputo (2022) 2022 Saputo Promise Report. [ONLINE] Available at: https://www.saputo.com/-/media/ecosystem/
divisions/corporate-services/sites/saputo-com/saputo-com-documents/our-promise/saputo-promise-
2022/fy2022_saputo-promise-report_final_eng.ashx?revision=ae814aad-9401-4011-8de0-1ac7a7e1927f
60 Dufrasne, G. (2022) EU works to beef up regulations on green claims while NGOs take to the courts to combat
greenwashing. Carbon Market Watch, 31 March 2022. [ONLINE] Available at: https://carbonmarketwatch.
org/2022/03/31/eu-works-to-beef-up-regulations-on-green-claims-while-ngos-take-to-the-courts-to-combatgreenwashing
61 European Commission (2020) Communication from the Commission to the European Parliament, the Council,
the European Economic and Social Committee and the Committee of the Regions on an EU strategy to reduce
methane emissions. [ONLINE] Available at: https://ec.europa.eu/energy/sites/ener/files/eu_methane_strategy.
pdf
62 Changing Markets Foundation (2022) Stranded in a vicious cycle? The case for transformation in animal
agriculture. [ONLINE] Available at: http://changingmarkets.org/wp-content/uploads/2022/07/CM-REPORT_-
STRANDED-IN-A-VICIOUS-CYCLE-_FINAL.pdf
63 IATP (2021) Emissions Impossible Europe. [ONLINE] Available at: https://www.iatp.org/emissions-impossible-
europe
64 IATP (2021) Emissions Impossible Europe.
65 United Nations Environment Programme and Climate and Clean Air Coalition (2021). Global Methane Assessment:
Benefits and Costs of Mitigating Methane Emissions. Nairobi, Kenya. [ONLINE] Available at: https://wedocs.
unep.org/bitstream/handle/20.500.11822/35917/GMA_ES.pdf
66 Global Methane Pledge (n.d.) Homepage. [ONLINE] Available at: https://www.globalmethanepledge.org
67 Climate and Clean Air Coalition (2021) Global Methane Pledge. [ONLINE] Available at: https://www.ccacoalition.
org/en/resources/global-methane-pledge
68 Boren, Z. (2022) Beef lobbyists celebrate methane ‘win’ at COP26. Unearthed, 7 March 2022. [ONLINE] Available
at: https://unearthed.greenpeace.org/2022/03/07/biden-methane-pledge-beef-climate-lobying
69 NCBA (n.d.) Affiliates and Industry Organizations. [ONLINE] Available at: https://www.ncba.org/about/affiliates-
industry-organizations
70 Saunois, M. et al. (2020) The Global Methane Budget 2000-2017. Earth System Science Data 12: 1561–1623
[ONLINE] Available at: https://doi.org/10.5194/essd-12-1561-2020
71 Global Methane Pledge (n.d.) Homepage. [ONLINE] Available at: https://www.globalmethanepledge.org
72 European Commission (2020): Communication from the Commission to the European Parliament, the Council,
the European Economic and Social Committee and the Committee of the Regions on an EU strategy to reduce
methane emissions.
73 CE Delft (2022) Methane reduction potential in the EU. [ONLINE] Available at: http://changingmarkets.org/
wp-content/uploads/2022/06/CE_Delft_210502_Methane_reduction_potential_in_the_EU_Def.pdf
74 CE Delft (2022) Methane reduction potential in the EU.
75 Changing Markets Foundation (2022) High steaks: How focusing on agriculture can ensure the EU meets its
methane-reduction plans. [ONLINE] Available at: http://changingmarkets.org/wp-content/uploads/2022/06/
CM-REPORT-ENG-HIGH-STEAKS.pdf
76 Van Halm, E. (2022) The Dutch nitrogen crisis shows what happens when policymakers fail to step up. Energy
Monitor, 16 August 2022. [ONLINE] Available at: https://www.energymonitor.ai/policy/the-dutch-nitrogen-crisis-
shows-what-happens-when-policymakers-fail-to-step-up
77 Stokstad, E. (2019) Nitrogen crisis from jam-packed livestock operations has ‘paralyzed’ Dutch economy.
Science, 4 December 2019. [ONLINE] Available at: https://www.science.org/content/article/nitrogen-crisis-
jam-packed-livestock-operations-has-paralyzed-dutch-economy
78 Stokstad, E. (2019) Nitrogen crisis from jam-packed livestock operations has ‘paralyzed’ Dutch economy.
79 Bounds, A. (2022) Dutch farmers in uproar over plans to curb animal numbers to cut nitrogen emissions.
Financial Times, 3 August 2022. [ONLINE] Available at: https://www.ft.com/content/90e38fb5-e942-4afd-
994d-048dc40579a2
80 Brzezinkski, B. and Gijs, C. (2022) Not easy being green: Rutte’s eco-friendly agenda falters amid Dutch farmer
backlash. Politico, 6 September 2022. [ONLINE] Available at: https://www.politico.eu/article/dutch-farm-crisisrocky-
path-climate-transition-henk-staghouwer
81 United States Environmental Protection Agency. Inventory of U.S. Greenhouse Gas Emissions and Sinks. [ONLINE]
Available at: https://www.epa.gov/ghgemissions/inventory-us-greenhouse-gas-emissions-and-sinks
82 United States Environmental Protection Agency (2021) US GHG inventory chapter 5 agriculture. [ONLINE]
Available at: https://www.epa.gov/sites/default/files/2021-04/documents/us-ghg-inventory-2021-chapter-
5-agriculture.pdf
83 United States Environmental Protection Agency (2021) US GHG inventory chapter 5 agriculture.
84 IATP (2022) Meeting the Methane Pledge: the U.S. can do more on agriculture. [ONLINE] Available at: https://
www.iatp.org/meeting-methane-pledge-us-can-do-more-agriculture
85 IATP (2022) Meeting the Methane Pledge: the U.S. can do more on agriculture.
86 Foehringer Merchant, E. and van Deelen, G. (2022) California has provided incentives for methane capture
at dairies, but the program may have ‘unintended consequences’. Inside Climate News, 19 September 2022.
[ONLINE] Available at: https://insideclimatenews.org/news/19092022/dairy-digesters-methane
87 Foehringer Merchant, E., van Deelen, G. (2022) California Has Provided Incentives for Methane Capture at
Dairies, but the Program May Have ‘Unintended Consequences’.
88 Bakkaloglu, S., Cooper, J., Hawkes, A. (2022) Methane emissions along biomethane and biogas supply
chains are underestimated. One Earth 5: 724–736. [ONLINE] Available at: https://doi.org/10.1016/j.
oneear.2022.05.012
89 Bakkaloglu, S., Cooper, J., Hawkes, A. (2022) Methane emissions along biomethane and biogas supply chains
are underestimated.
90 Marfrig (2021) Sustainability report, p.92 [ONLINE] Available at: https://api.mziq.com/mzfilemanager/v2/d/
b8180300-b881-4e6c-b970-12ad72a86ec8/123486e8-e4e3-2085-b073-7a9781f8224f?origin=2
91 Smithfield (n.d.) Sustainability. [ONLINE] Available at: https://www.smithfieldfoods.com/environment
92 Smithfield (n.d.) Sustainability.
93 Barnes, G. (2021) Environmentalists continue battle with lawmakers, pork industry over biogas from hog
waste. North Carolina Health News, 21 May 2021. [ONLINE] Available at: https://www.northcarolinahealthnews.
org/2021/05/21/biogas-environmentalists-vs-lawmakers-pork-industry
94 Azhar, A. (2022) EPA to probe whether North Carolina’s permitting of biogas from swine feeding operations
violates civil rights of nearby neighborhoods. Inside Climate News, 25 January 2022. [ONLINE] Available at:
https://insideclimatenews.org/news/25012022/epa-north-carolina-cafo-biogas-permit
95 Azhar, A. (2021) North Carolina’s new farm bill speeds the way for Smithfield’s massive biogas plan for
hog farms. Inside Climate News, 31 August 2021. [ONLINE] Available at: https://insideclimatenews.org/
news/31082021/north-carolina-farm-bill-biogas-smithfield
96 NZ Government. (2021) Releases. [ONLINE] Available at: https://www.beehive.govt.nz/release/nz-joins-global-
initiative-tackle-methane
97 Stats New Zealand (2022) New Zealand’s greenhouse gas emissions. [ONLINE] Available at: https://www.stats.
govt.nz/indicators/new-zealands-greenhouse-gas-emissions
98 Changing Markets (2021) Blindspot: How lack of action on livestock methane undermines climate targets. [ONLINE]
Available at: http://changingmarkets.org/wp-content/uploads/2021/10/Blindspot_methane-English.pdf
99 Ministry for the Environment (2022) [ONLINE] Available at: https://environment.govt.nz
100 He Wake Eke Noa (2022) About. [ONLINE] Available at: https://hewakaekenoa.nz/about
101 Corlett, E. (2022) New Zealand farmers may pay for greenhouse gas emissions under world-first plans. The
Guardian, 11 October 2022 [ONLINE] Available at: https://www.theguardian.com/world/2022/oct/11/new-zealand-
farmers-may-pay-for-greenhouse-gas-emissions-under-world-first-plans
102 Changing Markets Foundation (2021) Blindspot: How lack of action on livestock methane undermines climate
targets.
103 FAO (n.d.) Global Livestock Environmental Assessment Model. [ONLINE] Available at: https://www.fao.org/
gleam/resources/en
104 Forster, P., Storelvmo, T.,Armour, K., Collins, W., Dufresne, J.-L., Frame, D., Lunt, D.J., Mauritsen, T., Palmer,
M.D.,. Watanabe, M., Wild, M. and Zhang, H. (2021) The Earth’s Energy Budget, Climate Feedbacks, and Climate
Sensitivity. In: Climate Change 2021: The Physical Science Basis. Contribution of Working Group I to the Sixth
Assessment Report of the Intergovernmental Panel on Climate Change [V.,Masson-Delmotte, P. Zhai, A. Pirani,
S.L. Connors, C. Péan, S. Berger, N. Caud, Y. Chen, L. Goldfarb, M.I. Gomis, M. Huang, K. Leitzell, E. Lonnoy,
J.B.R. Matthews, T.K. Maycock, T. Waterfield, O. Yelekçi, R. Yu, and B. Zhou (eds.)]. Cambridge University Press,
Cambridge, UK and New York, NY, USA, pp. 923–1054, doi:10.1017/9781009157896.009., Table 7.15., p.1017
[ONLINE] Available at: https://www.ipcc.ch/report/ar6/wg1/downloads/report/IPCC_AR6_WGI_Chapter07.pdf
105 Wang, L., Xue, B., Yan, T. (2017) Greenhouse gas emissions from pig and poultry production sectors in China
from 1960 to 2010. Journal of Integrative Agriculture 16(1): 221–8. [ONLINE] Available at: https://www.sciencedirect.
com/science/article/pii/S2095311916613722
106 IFCN (2021) Press release: Top Dairy Processors commit to climate goals and show strong performance in
challenging times. [ONLINE] Available at: https://ifcndairy.org/top-dairy-processors-commit-to-climate-goals
107 JBS (2021) Institutional presentation, including 4Q21 and 2021 results. [ONLINE] Available at: https://api.
mziq.com/mzfilemanager/v2/d/043a77e1-0127-4502-bc5b-21427b991b22/89617df2-cf31-77d8-d102-
c2dee83873fb?origin=1j pgs, 12-15
108 Pereira, H (2022) Technical Opinion: Critical evaluation of the methodology adopted in the IATP (Institute
for Agriculture and Trade Policy) study to estimate JBS’ GHG emissions. WayCarbon, Version 1.0, July 2022.
[ONLINE] Available at: https://jbs.com.br/wp-content/uploads/2022/08/-jbs-technical-note-iatp-eng.pdf
109 JBS (2021) Institutional presentation, including 4Q21 and 2021 results
110 Clements, M. (2022) Top world broiler and egg rankings for 2021. WATTPoultry.com [ONLINE] Available at:
https://www.wattagnet.com/articles/45506-top-world-broiler-and-egg-rankings-for-2021
Downloads:
Download a PDF of the full report with references.
Annexes 1 and 2
English Executive Summary
Original Datasets:
Primary dataset
Translations of the Executive Summary:
Spanish translation of the Executive Summary (Descargue la traducción al español del resumen ejecutivo.)
French translation of the Executive Summary (Télécharger une traduction française du résumé exécutif.)
German translation of the Executive Summary (Download einer deutschen Übersetzung der Zusammenfassung.)
Portuguese translation of the Executive Summary (Descarregar uma tradução em português do resumo executivo.)