IATP welcomes an informed debate on all our publications. Our June 2020 report, Milking the Planet: How Big Dairy is heating up the planet and hollowing rural communities, has generated strong responses from the dairy industry and conversations on social media. This Q&A addresses some of the most salient questions and comments. Our mission is to provide research and analysis to advocate for the right mix of farm, trade and climate policies that are good for the planet, people and the food system. Our report was written with that purpose.
Responses to questions/comments
Methodology and Data
1. What methodology did IATP use for calculating companies’ emissions in Milking the Planet?
IATP used the U.N. Food and Agriculture Organization (FAO)’s Global Livestock Environmental Assessment Model (GLEAM) for the emissions factors (found at www.fao.org/gleam/en/). We multiplied the emissions factors with the milk intake data (amount of milk processed by each company) from the IFCN Dairy Research Network. For more information, see Annex 1 of the Milking the Planet report and its underlying data set at: www.iatp.org/milking-planet-data.
The emissions estimates obtained with GLEAM are intended to be approximate indicators of corporate emissions in the absence of standard and transparent emissions calculations and reporting across the industry. Our calculations are likely conservative estimates given that GLEAM limits land-use change to “the transformation of forest to arable land for feed crops and that of forest to pasture” and uses the basic IPCC Tier 1 guidelines1 rather than more detailed calculations. In reality, more pastureland expansion has taken place on natural grasslands and cropland expansion replaced mainly forests (IPCC Special Report on Land, chapter 1). Large conversions have also taken place in dry woodlands and savannas, for instance the Cerrado in Brazil. GLEAM also limits feed crop expansion to soybean and palm oil, thus excluding corn, barley, sorghum and other oilseeds used in animal feed. A comparison between our calculations and the self-reported estimates of the dairy companies Danone and Saputo substantiate that our estimates are slightly more conservative than the companies’ own.
1. A tier indicates the level of methodological complexity: “Tier 1 is the basic method, Tier 2 intermediate and Tier 3 the most demanding in terms of complexity and data requirements. Tiers 2 and 3 are sometimes referred to as higher tier methods and are generally considered to be more accurate on condition that adequate data are available to develop, evaluate and apply a higher tier method.” https://www.ipcc.ch/site/assets/uploads/2019/05/01_2019rf_OverviewChapter.pdf
2. The International Dairy Federation (IDF) and the Global Dairy Platform (GDP), in their statement on the report, state: “One of the key claims in this report is that the top 13 global dairy companies saw an 11% increase in GHG emissions between 2015 and 2017. This is misleading, as much of the increase can be accounted for by mergers and acquisitions by those companies. Annex 1 in the report even confirms this is simply an accounting change, and these are not new emissions.” Have mergers and acquisitions by the top 13 global dairy companies contributed to the increase in emissions?
Our data shows that the milk processed by the 13 corporations went up by 8% in two years and their emissions went up by 11%. We compared the emissions these companies were responsible for between 2015 and 2017. The increase in their milk intake and emissions is significant and merits global attention. How much of that increase is due to mergers and acquisitions rather than an increase in the number of animals producing milk is unclear due to lack of corporate transparency in publicly reporting these figures. Making public 1) the number of total additional animals producing milk per company and 2) the number of additional milk-producing animals due to mergers and acquisitions would provide a useful set of data points for further analysis.
Our calculations, indeed, include mergers and acquisitions because companies and their investors must own the climate footprint and risk they add to their operations due to mergers and acquisitions. The four (Fonterra, Nestlé, Saputo and Danone) out of the 13 companies that report their emissions to the Carbon Disclosure Project (CDP) all fail to include some or all their subsidiaries and/or acquisitions in emissions reporting. The increase in climate risk due to expansion of operations and animals must be considered in rating companies’ climate and financial risk.
3. Why are IATP’s estimates for Fonterra’s emissions nearly double that of what Fonterra estimates as its emissions (44M tonnes of C02e rather than 22M)?
We examined emissions of 13 dairy corporations in our report. Out of the 13, only four companies (Fonterra, Nestlé, Saputo and Danone) report their emissions to the Carbon Disclosure Project. See our first response regarding GLEAM providing a conservative estimate compared to Danone and Saputo’s reporting.
Our estimates of Fonterra’s emissions come from its 2017 milk intake multiplied by the emissions factor that the FAO’s GLEAM model allocates to the Oceania region. Weighted for the average amount of milk produced in New Zealand, this emissions factor is: 1.88 kg CO2e per kg FPCM compared to the global average of 2.9 kg of CO2e. When we published our 2018 report Emissions Impossible: How big meat and dairy are heating up the planet with GRAIN we received a similar critique from Fonterra and provided them the already-public data behind our estimates. We asked Fonterra to share the data underpinning their emissions estimates to assess what errors we might have made. We did not receive a reply. We would very much welcome 1) an understanding of the emissions factor Fonterra uses to calculate their emissions and 2) why there is such a large discrepancy between the FAO GLEAM emissions factor and the one Fonterra uses.
Climate Science and Dairy Management
4. In response to our report, the IDF and the GDP claimed that globally, all of agriculture accounts for 24% of greenhouse gas (GHG) emissions, and within that dairy is responsible for 2.7%. What is the current state of the dairy industry in terms of its carbon footprint?
It is difficult to arrive at precise calculations of aggregate global dairy-related emissions, not least because a percentage of dairy cows end up as meat. This peer-reviewed study published in 2014 finds: “Depending on the method chosen to allocate emissions between milk and meat, the relative difference between the carbon footprints of grass-based and confinement dairy systems varied by 3 to 22%. This indicates that further harmonization of several aspects of the LCA (Life Cycle Analysis) methodology is required to compare carbon footprints of contrasting dairy systems.”
A 2013 FAO study, Tackling climate change through livestock, estimates that livestock contribute 14.5% of all GHG emissions. Moreover, the IPCC Special Report on Land notes: “If emissions associated with pre- and post-production activities in the global food system are included, the emissions are estimated to be 21–37% of total net anthropogenic GHG emissions.”
The IDF and GDP appear to have referred to this 2010 FAO study when citing that dairy accounts for 2.7% of all GHG emissions. In fact, the same study estimates that the global dairy sector contributes 4% [±26 percent] of total global GHG emissions. This includes “emissions associated with milk production, processing and transportation, as well as the emissions from meat production from dairy-related culled and fattened animals.” It also states: “The overall contribution of the global milk production, processing and transportation to total anthropogenic emissions is estimated at 2.7 percent [±26 percent].” However, the study fails to include land-use change in its emissions calculations. The 2.7% estimate also has a ±26 percent margin of error because “a lack of data forced the research team to rely on generalisations and projections.” Moreover, land-use change calculations are limited to deforestation which occurred between 1990-2010.
The lack of transparent and public data published by corporations and the lack of consistent and comparable emissions accounting and reporting continues to prevent precise estimates of dairy emissions. Finally, the IPCC revised its emissions factors for livestock and manure management in the 2019 Refinement to the 2006 IPCC Guidelines for National Greenhouse Gas Inventories. This is not reflected in the 2010 FAO study referenced by the IDF and GDP.
5. The report appears to advocate for smaller, more extensive systems of dairying. Yet, some would argue that intensive systems of livestock production could produce fewer emissions per unit of milk or meat, far less than more extensive systems. Would that not make intensive systems better for the climate?
Ninety percent of the emissions in corporate dairy supply chains come from the animals themselves. The more animals there are, the more emissions there will be. In our report, we state: “Emissions intensity reduction pledges allow for greenwashing because companies can highlight emissions reductions per litre of milk even if their total emissions continue to rise due to increases in milk production and rising numbers of animals in supply chains.”
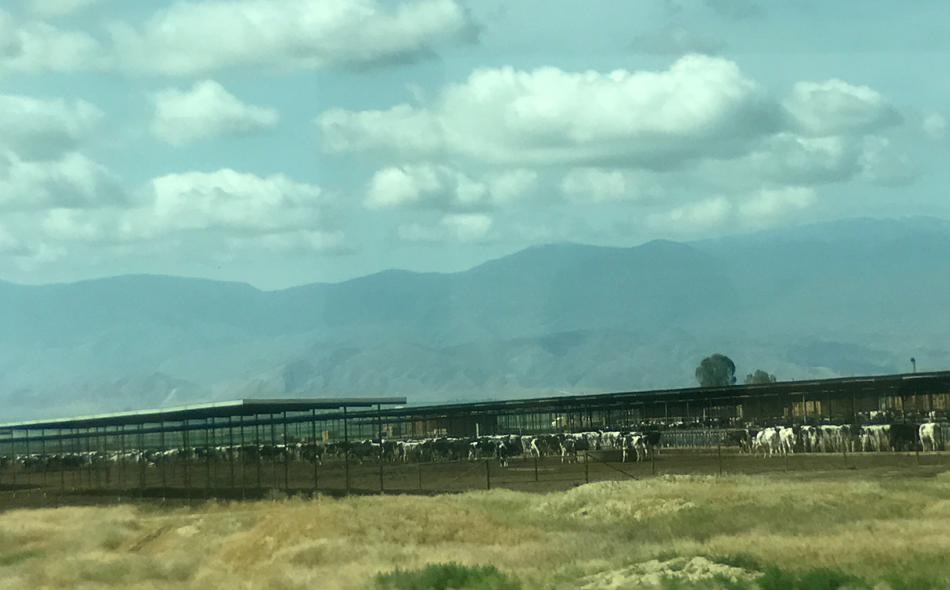
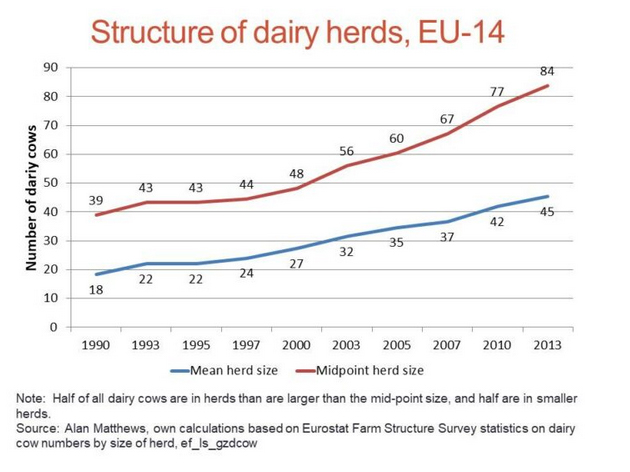
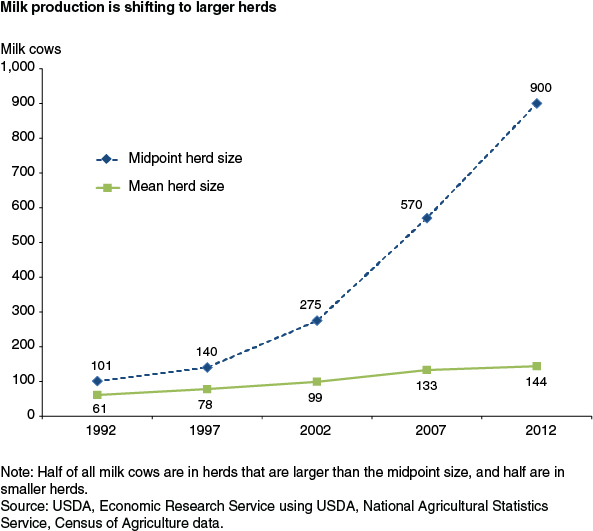
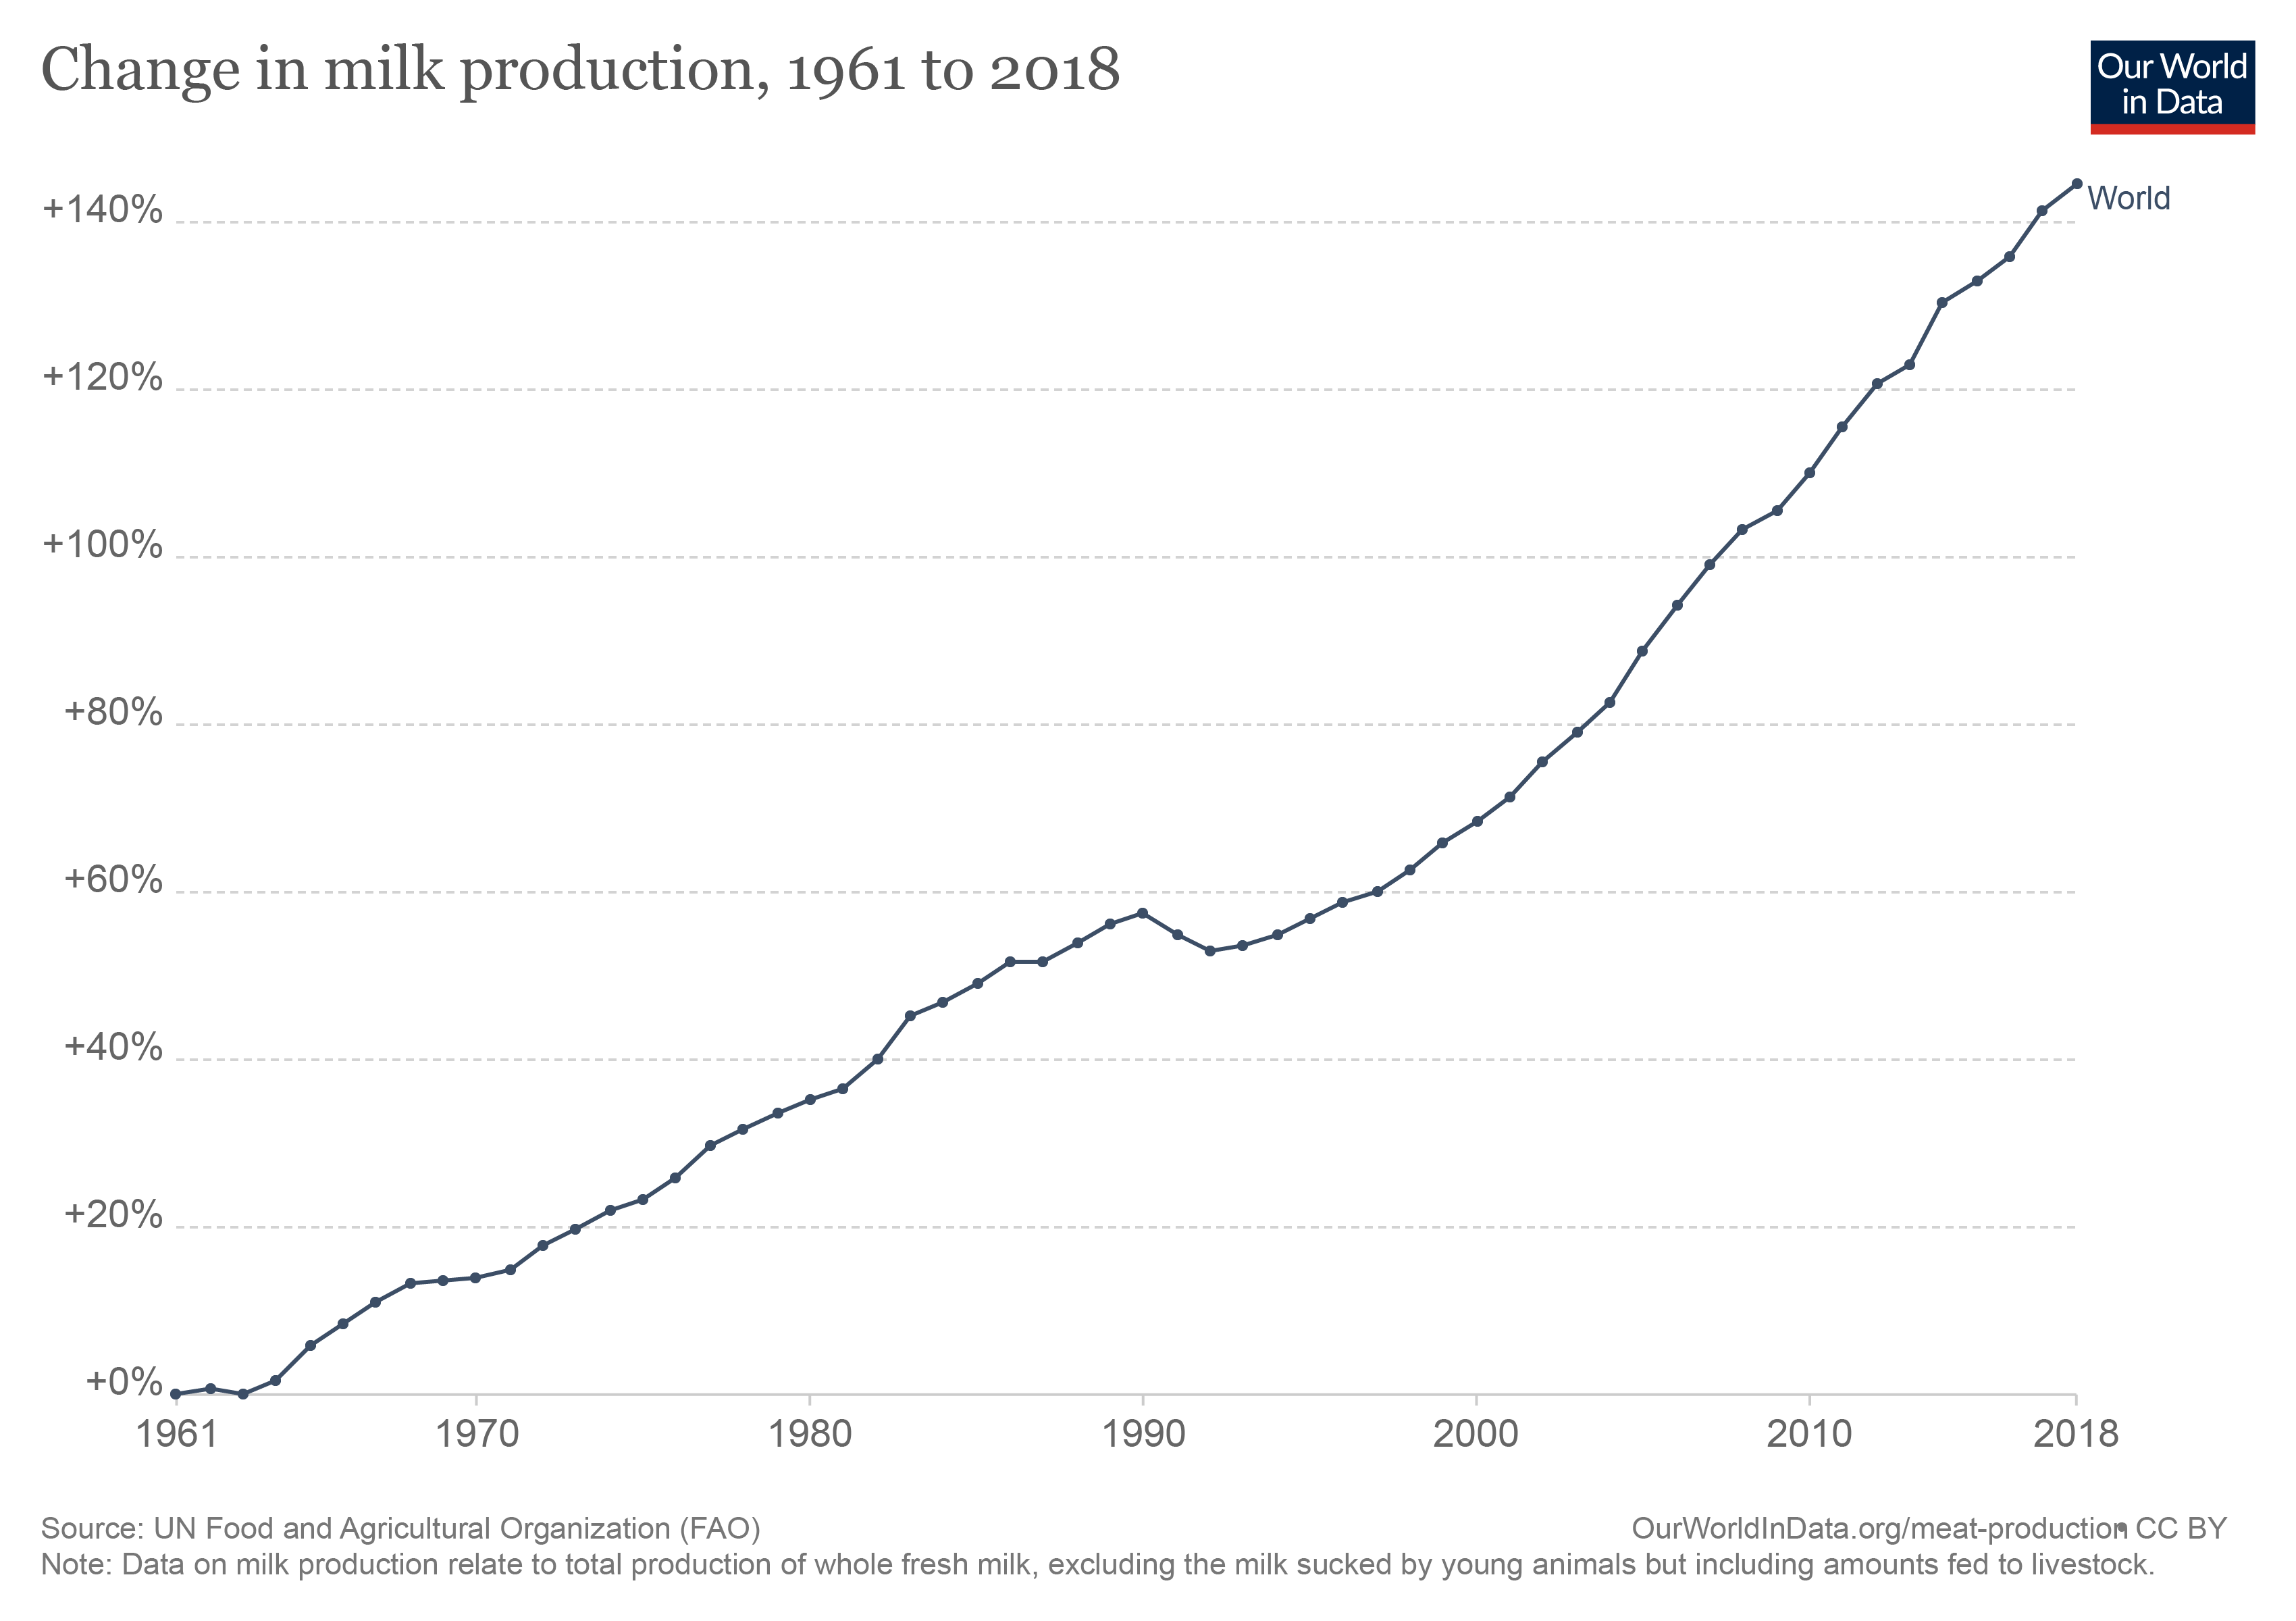
The industrial model of livestock production incentivizes economies of scale and feed grain dependence, leading to decades of rising cattle numbers and dairy herds. This has happened even as the total number of dairy farms have declined dramatically in industrialized countries. Graphs 1-3 show that the size of dairy herds has steadily risen in major milk producing countries as global milk production has ramped up. For instance, over half of the U.S.’s dairy herds were over 900 cows in 2012; in the EU, over 80 cows. New Zealand’s graph shows a similar pattern of declining number of herds, but a doubling and tripling of the herd size in the last three decades.
According to the FAO, feed production and processing comprise the largest source of livestock emissions at 45% of the total, followed by cattle burps, also known as enteric fermentation at 39%. This means 84% of total emissions attributed to the livestock sector are directly linked to the number of cattle in production and their dependence on feed grains.
Our report addresses this economies-of-scale industrial model of production that too often relies on heavy use of feed, feed lots or high stocking densities and poorly managed pasture.
CAP Reform EU, “Measuring changing farm structure in the EU,” March 13, 2018. http://capreform.eu/measuring-changing-farm-structure-in-the-eu/ (accessed March 17, 2021).
CAP Reform EU, “Measuring changing farm structure in the EU,” March 13, 2018. http://capreform.eu/measuring-changing-farm-structure-in-the-eu/ (accessed March 17, 2021).
Our World in Data. https://ourworldindata.org/grapher/milk-production-tonnes?tab=chart&stackMode=relative&country=~OWID_WRL (accessed March 17, 2021).
6. Isn’t it better to produce more efficiently at a mass scale to “feed the world” especially given that less industrial systems produce a lot less with more emissions? By 2050, we will have nearly 10 billion people who will need nutritional food that dairy provides.
The “feeding the world” myth that the industry perpetuates must be called out. Over 800 million tons of milk were produced in 2019. Per capita consumption of dairy in industrialized countries is high and must come down. It is well over 200 kg per person per year compared to 86 kg per person per year in India or 94.8 kg per person per year in Kenya. One serving (1 cup or 245 grams) of dairy per day is considered a healthy and environmentally sustainable amount if other nutritional needs are met, translating to 89 kg per person per year.
The FAO’s State of Food Security and Nutrition in the World 2019 report states: “It is unacceptable that, in a world that produces enough food to feed its entire population, more than 1.5 billion people cannot afford a diet that meets the required levels of essential nutrients and over 3 billion people cannot even afford the cheapest healthy diet.” Over one-quarter of the world’s population currently experiences hunger while obesity is on the rise in all regions of the world. Production of milk, meat and grains continues to rise, yet hunger, malnutrition and obesity are prevalent. Nutrition and hunger have never been about enough food, but rather about power, agency and poverty. Therefore, our report stresses the importance of rural livelihoods. The percentage of people employed through agriculture remains upwards of 30% in most developing countries, employing as many as 50-80% in many of them. Nearly half (45%) of the global population was still rural in 2020. Equity, human rights and social justice must therefore be an essential part of ensuring food security and any climate action on dairy and agriculture overall.
7. Some dairy industry scientists have said focusing on short-lived pollutants like methane distracts from more important long-lasting GHGs like CO2. Methane generated from cows lives in the atmosphere for about 10 years, while CO2, the largest source of GHGs, accumulates in the atmosphere and continues to warm the planet for years. Isn’t it disingenuous to compare biogenic methane from cows to CO2 from fossil fuels?
First, IATP believes that all climate polluters should be held accountable, particularly well-resourced corporations that have contributed significantly to the climate crisis. IATP refers to fossil fuel company emissions by way of comparison to illustrate just how large dairy industry emissions are in CO2 equivalent metric tons. The report devotes two sentences in a 20-page report to this comparison: “Thirteen of the world’s largest dairy corporations combined to emit more greenhouse gases (GHGs) in 2017 than either BHP, the Australia based mining, oil and gas giant or ConocoPhillips, the United States-based oil company. Both make the world’s top 20 list of the biggest fossil fuel emitters, also known as the carbon majors.” Nowhere does IATP or the report suggest that fossil fuel companies should not be held to account. In fact, IATP has endorsed civil society statements demanding that fossil fuel companies should be held accountable for their climate footprint.
Second, all methane molecules behave the same way in the atmosphere even if they come from two different types of sources: biological and fossil. However, fossil methane breaks down into quantities of CO2 when it disappears from the atmosphere, while biological methane does not. The IPCC with high confidence states that biogenic sources of methane make up a larger proportion of emissions than they did before 2000, with a rise between 2007-2016, due to increasing number of ruminants and expansion of rice cultivation (IPCC Land Report, Summary for Policy Makers, Para A.3.4). Moreover, methane is several orders of magnitude more potent than CO2 while in the atmosphere. As noted by scientists at the University of Oxford: “Since methane has a powerful effect as a greenhouse gas, even relatively small increases in concentration can have a major climate impact, making the recent observations of increasing atmospheric methane highly concerning. The reverse is also true. Because of its short atmospheric lifetime, if we reduce methane emissions, we expect the atmospheric concentration would fall relatively quickly. So reducing methane emission rates presents an important mitigation opportunity which could reverse some of the warming we already experience.” Reducing methane in the short term could therefore have a cooling impact and perhaps give us the chance to avoid several tipping points in the coming decade.
In 2018, the IPCC Special Report on Global Warming of 1.5C suggested that governments must take concerted action within 12 years for a fighting chance to limit warming to 1.5C. The massive destruction caused by wildfires in California and Oregon are a tragic and living example of why this is critical. To suggest that biogenic methane is “only around for 10 years” is thus misleading regarding the climate crisis we face. Mega-dairy expansion contributes to rising ruminant numbers and therefore rising (not constant) methane emissions. We have no time to lose.
8. So why is IATP critical of biogas digestors which help mega-dairies actually cut their methane emissions? In California, for instance, support from the government has helped these dairies cut emissions by 25% from 2013 levels.
We believe biogas digestors are the wrong incentive to cut dairy emissions because they address, in part only, just one symptom of far bigger systemic problems discussed in our report. Mega-dairies store large amounts of liquid manure in storage pits generating both nitrous oxide and methane. When expensive and publicly subsidized digestor technology is not being applied to them, the liquid sits throughout the year, leading to air pollution and leaching. Large quantities of manure are also diluted and spread across surrounding areas, creating a public health hazard to local communities when leached into groundwater. Leaching leads to nitrate contamination, which prohibits residents from drinking the water. Public funds are then again used to clean up the problem.
In Milking the Planet, we advocate for an environmentally and socially just model of dairying that is good for the planet and the people who produce and drink milk. Companies should abandon endless growth models. For a real shift, we need farm, trade and climate policies to align. We are calling on governments to redirect public funds (including state, CAP and Farm Bill funds) towards regenerative, agroecological agriculture that supports rural family farms and helps them transition away from industrial agriculture. They must regulate corporations to pay for the environmental, social and public health impacts of the industrial model these transnational corporations perpetuate, and governments must help foster the revival of rural communities and build soil health. This includes ensuring that trade agreements do not undermine such regulations. The outcome of these changes must keep farmers on the land and transition to a more just and sustainable system.
9. Why does your report only account for the emissions from dairying and not include an accounting of emissions that are removed from the atmosphere through carbon sequestration in well-managed pasture-based dairying?
IATP whole-heartedly supports dairying on well-managed pasture with appropriate stocking densities, perennial grasses and other practices that help sequester carbon and build soil health through grazing. However, IATP has written extensively about the problems related to monitoring, accounting and verifying soil carbon sequestration. These problems include: 1) Soil carbon storage is impermanent, susceptible to changes due to droughts, floods, fires or human interference such as changes to land management practices; 2) Tools to measure soil carbon accurately and cost-effectively do not exist yet; 3) Soil carbon storage is frequently tied to highly problematic soil carbon markets that enable polluters to “offset” their emissions by purchasing soil carbon credits instead of directly reducing their own emissions. Instead, we believe that farmers should receive stable public funding to build soil health and good grazing practices that help sequester carbon and build climate resilience. This would yield numerous social, ecological and animal welfare benefits in addition to benefiting the climate. It also avoids perverse incentives for investing in markets that allow polluters to continue polluting.
Downloads:
Download the PDF.
Download a copy of Milking the Planet.
Watch:
Watch a short video on Milking the Planet.