Download a PDF of this report here.
Introduction
Since IATP’s 2021 publication Closed Out: How U.S. farmers are denied access to conservation programs, there has been some positive development for conservation agriculture policy in the United States. Congress passed, and President Joe Biden signed, the Inflation Reduction Act, which dedicated $19.5 billion in additional funding for programs such as the Conservation Stewardship Program (CSP) and the Environmental Quality Incentives Program (EQIP).
EQIP and CSP are key tools for helping farms and farmers adapt to a changing climate, supporting practices as targeted as grassed waterways or as comprehensive as a farm-wide suite of practices that improve wildlife habitat or water quality. While some practices help store carbon or reduce methane emissions, more important in our view is the added income and climate resilience that these programs can provide to farmers, helping them stay afloat and move in the direction of a more agroecological approach to farming.
Since 2020, the last year for which we assessed data in Closed Out, we have seen a few interesting developments. In 2022, the number of CSP applications shot up, as did the number of contracts awarded. Instead of the 18.2% of CSP applicants awarded contracts nationwide in 2020, last year 24.8% of CSP applicants were awarded contracts. This means that the United States Department of Agriculture (USA) awarded around 3,000 more contracts nationwide in 2022 than in 2020. Many of those projects will help farmers adapt to a changing climate and improve soil health, water quality, and maintain and allow farms to operate in a more agroecological way. Despite this improved ratio of applications to contracts awarded, USDA still rejects more than three in four farmer applications to CSP.
With EQIP, the trend is not as clear. Both the number of contracts and the number of applicants has decreased since 2020. The percentage of applicants awarded contracts in both years was remarkably similar, 25.9%.
Drilling down, there was a wide variation in approval rates among states. For example, both Nevada and Montana awarded contracts to 40% of their applicants in 2022. In Nevada, that percentage translates to 64 contracts, while in Montana it is 466. Having a high percentage of applicants means different things in different states, and we acknowledge the shortcomings of this metric. Likewise, while both Mississippi and West Virginia awarded slightly over 200 CSP contracts, West Virginia is near the top of the list in percentage awarded, while Mississippi is at the very bottom. Additionally, many farmers are not reflected in these numbers: namely, those who want to apply for contracts but choose not to for a variety of reasons, whether it is the requirement that most farmers pay for the practice up front and get reimbursed later, the paperwork involved or a lack of technical assistance from USDA at the local level. Farmers should not feel closed out of the process to the extent that they don’t apply at all.
What has changed since 2020?
Fiscal Year 2022 is the first full year of data during the Biden administration. While in 2022, Congress might not have dedicated significant new money to EQIP and CSP compared to 2020, USDA has made some important improvements to the programs. For example, under previous policy, a farmer with an expiring CSP contract was required to wait two years before reapplying to the program. In 2022, USDA changed this requirement so that a contract renewal can start right when the old contract expires. This contract continuity helps ensure that land in conservation is kept in conservation and that a lack of funds does not mean a farmer reverses any land improvements.
USDA also added what are known as “Conservation Incentive Contracts” to EQIP to help farmers add layers of conservation on top of existing EQIP practices. In a sense, these CICs help make the transition from EQIP to CSP smoother and help farmers approach conservation from a whole-farm perspective.1 IATP supports CICs because they help EQIP fulfill its intended purpose: to conserve land resources and help farmers build on existing conservation, with a smooth graduation to CSP.
The Biden administration has also committed to improving outreach to farmers of color and others historically left out of USDA conservation programs. While both EQIP and CSP are important climate tools, it is important that they help farmers of all backgrounds and farm sizes and do not deepen existing inequities. The administration has also committed to staffing USDA county offices with more conservation experts, who can help farmers navigate the complex paperwork that accompanies these programs. Much work still needs to be done, but this is a step in the right direction.
What about the Inflation Reduction Act?
In 2022, Congress passed, and President Biden signed, the Inflation Reduction Act. This Act, known as the IRA, which is now being implemented for Fiscal Year 2023, dedicated roughly $20 billion to conservation agriculture to be stair-stepped up over the next few years. Within that $20 billion, $3.25 billion is reserved for CSP and $8.45 billion for the EQIP. IATP supported these additional funds for CSP and EQIP as a small but important step toward meeting farmer demand and achieving a more agroecological food and farm system.
IRA funds begin in Fiscal Year 2023, so this report does not reflect the new IRA funding. In future updates that include FY23 data, the impact of this funding likely will be evident.
After the IRA became law, USDA sought input on the implementation of the Act. IATP submitted comments outlining the most important factors in implementation.2 We believe these funds should be easy to access for farmers of all sizes. We also believe that funds should be dedicated to agricultural practices that reflect agroecological principles and should not be spent on ineffective, false climate solutions, such as anaerobic methane digesters and manure lagoons on large-scale animal operations, which subsidize an environmentally damaging system.
In 2023, with the five-year Farm Bill set to expire, the opportunity for building on the progress of the IRA is strong and should not be wasted. With additional federal conservation spending in the Farm Bill, we can get closer to addressing why so many farmers are closed out of CSP and EQIP.
Why do some states receive more funding than others?
Unlike other programs run by the federal government where funding is based on population, dollars for conservation programs are allocated based on a formula that considers factors such as cropland and grazing land acreage, erosion, river and stream impairment, and national priorities determined by USDA.3 Historically, this formula has benefited states such as California, Texas and Minnesota.
Nationwide, under current law, 50% of EQIP funding is required to go toward livestock-focused practices, and 10% of EQIP funds should benefit wildlife habitat.4 Because these percentages are nationwide; if a state such as New Hampshire cannot allocate 50% of its funding for livestock practices, that funding can be reallocated to a different state such as Iowa that can. While there are climate-resilient livestock practices, such as advanced grazing management and pasture improvements, that provide wildlife habitat, there are also some conservation program-funded livestock practices that are anything but resilient. As IATP laid out in its 2022 report Payments for Pollution, industrial livestock practices, such as manure lagoons and animal mortality facilities, use a significant portion of EQIP funds, running counter to the purpose of the program.5
Luckily, the additional funding through the Inflation Reduction Act does not include the 50% funding requirement for livestock, with funding instead targeted toward practices USDA designates as “climate smart.” Since the livestock set aside is arbitrary and, in some instances, contrary to the intent of EQIP, we encourage Congress to remove this requirement in the upcoming Farm Bill.
Is USDA awarding more farmers EQIP and CSP contracts?
In 2022, more farmers received CSP and EQIP contracts than in each of the previous four years. Particularly for CSP, not only did the percentage of applicants receiving awards rise, but also more total contracts were awarded. While there are marked improvements in 2022, we are still scratching the surface when it comes to demand for these programs. In Minnesota, for example, only 241 of 3,001 CSP applications in 2022 were awarded contracts, or roughly 8%.
Minnesota has long been a leader in conservation agriculture, awarding more CSP contracts than any other state since 2010.6 Many of the 2,760 applications that were not awarded contracts could have improved soil health, water quality or simply provided an extra source of income for farmers. It is difficult to determine what happens to land that would otherwise be enrolled in a conservation program. Undoubtedly, some of the land is conserved anyway. More likely, however, much of the land that would otherwise be in a CSP or EQIP contract continues being farmed conventionally.
Table 1. 2022 EQIP Applications and Contracts Awarded by State7
Ranking
|
State
|
# of Applications
|
# of Contracts Awarded
|
% of Applications Awarded Contracts
|
1
|
Rhode Island
|
202
|
119
|
58.91%
|
2
|
Pacific Basin
|
88
|
47
|
53.41%
|
3
|
New Hampshire
|
502
|
245
|
48.80%
|
4
|
North Dakota
|
1,119
|
532
|
47.54%
|
5
|
Massachusetts
|
279
|
132
|
47.31%
|
6
|
Alabama
|
3,224
|
1,485
|
46.06%
|
7
|
Delaware
|
367
|
159
|
43.32%
|
8
|
Alaska
|
74
|
32
|
43.24%
|
9
|
Idaho
|
1,125
|
479
|
42.58%
|
10
|
Oregon
|
1,088
|
445
|
40.90%
|
11
|
Nevada
|
157
|
64
|
40.76%
|
12
|
Montana
|
1,163
|
466
|
40.07%
|
13
|
New York
|
1,013
|
403
|
39.78%
|
14
|
Maryland
|
664
|
260
|
39.16%
|
15
|
Arizona
|
386
|
151
|
39.12%
|
16
|
Michigan
|
2,043
|
783
|
38.33%
|
17
|
Connecticut
|
210
|
79
|
37.62%
|
18
|
Wisconsin
|
2,937
|
1,064
|
36.23%
|
19
|
Maine
|
1,105
|
394
|
35.66%
|
20
|
Texas
|
8,587
|
3,004
|
34.98%
|
21
|
Wyoming
|
687
|
240
|
34.93%
|
22
|
Ohio
|
2,746
|
945
|
34.41%
|
23
|
Virginia
|
1,405
|
481
|
34.23%
|
24
|
New Jersey
|
761
|
257
|
33.77%
|
25
|
Hawaii
|
310
|
103
|
33.23%
|
26
|
Indiana
|
2,655
|
854
|
32.17%
|
27
|
Vermont
|
869
|
274
|
31.53%
|
28
|
Washington
|
881
|
271
|
30.76%
|
29
|
Florida
|
1,939
|
570
|
29.40%
|
30
|
Nebraska
|
3,406
|
949
|
27.86%
|
31
|
West Virginia
|
1,429
|
397
|
27.78%
|
32
|
Tennessee
|
3,127
|
831
|
26.57%
|
33
|
Minnesota
|
3,398
|
903
|
26.57%
|
34
|
Colorado
|
1,584
|
412
|
26.01%
|
35
|
New Mexico
|
1,317
|
330
|
25.06%
|
36
|
Kentucky
|
3,142
|
782
|
24.89%
|
37
|
South Dakota
|
1,539
|
378
|
24.56%
|
38
|
Oklahoma
|
3,628
|
871
|
24.01%
|
39
|
South Carolina
|
2,690
|
645
|
23.98%
|
40
|
Kansas
|
2,854
|
673
|
23.58%
|
41
|
California
|
5,296
|
1,246
|
23.53%
|
42
|
Louisiana
|
2,173
|
504
|
23.19%
|
43
|
Missouri
|
4,232
|
941
|
22.24%
|
44
|
Utah
|
1,728
|
367
|
21.24%
|
45
|
Arkansas
|
7,190
|
1,455
|
20.24%
|
46
|
Iowa
|
4,127
|
823
|
19.94%
|
47
|
Pennsylvania
|
2,203
|
436
|
19.79%
|
48
|
Mississippi
|
11,328
|
2,204
|
19.46%
|
49
|
Caribbean Area
|
1,270
|
238
|
18.74%
|
50
|
Georgia
|
6,760
|
1,256
|
18.58%
|
51
|
Illinois
|
2,263
|
371
|
16.39%
|
52
|
North Carolina
|
3,259
|
506
|
15.53%
|
Table 2. 2022 CSP Applications and Contracts Awarded by State8
Ranking
|
State
|
# of Applicants
|
# of Contracts Awarded
|
% of Applicants Awarded Contracts
|
1
|
Rhode Island
|
41
|
35
|
85.37%
|
2
|
West Virginia
|
282
|
207
|
73.40%
|
3
|
Idaho
|
118
|
85
|
72.03%
|
4
|
Connecticut
|
34
|
24
|
70.59%
|
5
|
Ohio
|
340
|
240
|
70.59%
|
6
|
Michigan
|
454
|
306
|
67.40%
|
7
|
Pacific Basin
|
64
|
41
|
64.06%
|
8
|
New York
|
208
|
133
|
63.94%
|
9
|
South Carolina
|
789
|
484
|
61.34%
|
10
|
New Hampshire
|
56
|
33
|
58.93%
|
11
|
Massachusetts
|
31
|
18
|
58.06%
|
12
|
Vermont
|
60
|
34
|
56.67%
|
13
|
Caribbean Area
|
47
|
26
|
55.32%
|
14
|
Hawaii
|
71
|
39
|
54.93%
|
15
|
Utah
|
141
|
77
|
54.61%
|
16
|
Maryland
|
92
|
50
|
54.35%
|
17
|
Arizona
|
52
|
28
|
53.85%
|
18
|
New Jersey
|
69
|
36
|
52.17%
|
19
|
Indiana
|
399
|
207
|
51.88%
|
20
|
California
|
172
|
89
|
51.74%
|
21
|
Florida
|
273
|
134
|
49.08%
|
22
|
Nevada
|
34
|
16
|
47.06%
|
23
|
Pennsylvania
|
532
|
224
|
42.11%
|
24
|
Maine
|
71
|
28
|
39.44%
|
25
|
Wyoming
|
33
|
13
|
39.39%
|
26
|
Colorado
|
294
|
115
|
39.12%
|
27
|
Tennessee
|
685
|
263
|
38.39%
|
28
|
Washington
|
342
|
125
|
36.55%
|
29
|
Alabama
|
552
|
196
|
35.51%
|
30
|
Virginia
|
513
|
177
|
34.50%
|
31
|
Wisconsin
|
1,419
|
487
|
34.32%
|
32
|
Kentucky
|
360
|
123
|
34.17%
|
33
|
New Mexico
|
271
|
87
|
32.10%
|
34
|
North Carolina
|
664
|
209
|
31.48%
|
35
|
Iowa
|
1,243
|
375
|
30.17%
|
36
|
Oregon
|
432
|
120
|
27.78%
|
37
|
Missouri
|
1,695
|
445
|
26.25%
|
38
|
Delaware
|
28
|
7
|
25.00%
|
39
|
Louisiana
|
874
|
211
|
24.14%
|
40
|
Texas
|
427
|
102
|
23.89%
|
41
|
Illinois
|
1,252
|
275
|
21.96%
|
42
|
Oklahoma
|
1,260
|
266
|
21.11%
|
43
|
Kansas
|
612
|
129
|
21.08%
|
44
|
Alaska
|
5
|
1
|
20.00%
|
45
|
North Dakota
|
994
|
177
|
17.81%
|
46
|
Montana
|
715
|
127
|
17.76%
|
47
|
Nebraska
|
1,509
|
215
|
14.25%
|
48
|
Georgia
|
1,897
|
265
|
13.97%
|
49
|
South Dakota
|
1,167
|
141
|
12.08%
|
50
|
Arkansas
|
2,221
|
231
|
10.40%
|
51
|
Minnesota
|
3,001
|
241
|
8.03%
|
52
|
Mississippi
|
3,227
|
243
|
7.53%
|
Have more farmers received CSP and EQIP contracts lately?
Figure 1 examines the percentage of applications to EQIP and CSP that turned into contracts.9 The graph reveals several interesting trends. Since budget sequestration in the early 2010s, and to an extent since the 2018 Farm Bill, when Congressional funding for CSP was stair stepped down from approximately $2.3 billion per year in FY 2019 to a projected $1.4 billion per year in FY 2023,10 there is a clear downward trend in CSP enrollment. The cut in funding, combined with confusion around renewal eligibility, changing ranking tools and a weakening of the original comprehensive intent of CSP, are likely factors in the persistent gap. During the previous administration, there was a push to gear CSP more toward first-time conservationists and de-emphasize the need for graduation between EQIP and CSP. This new emphasis on first-time conservationists made long-held ranking criteria that helped farmers apply to these programs with confidence less clear, leaving farmers in the lurch.
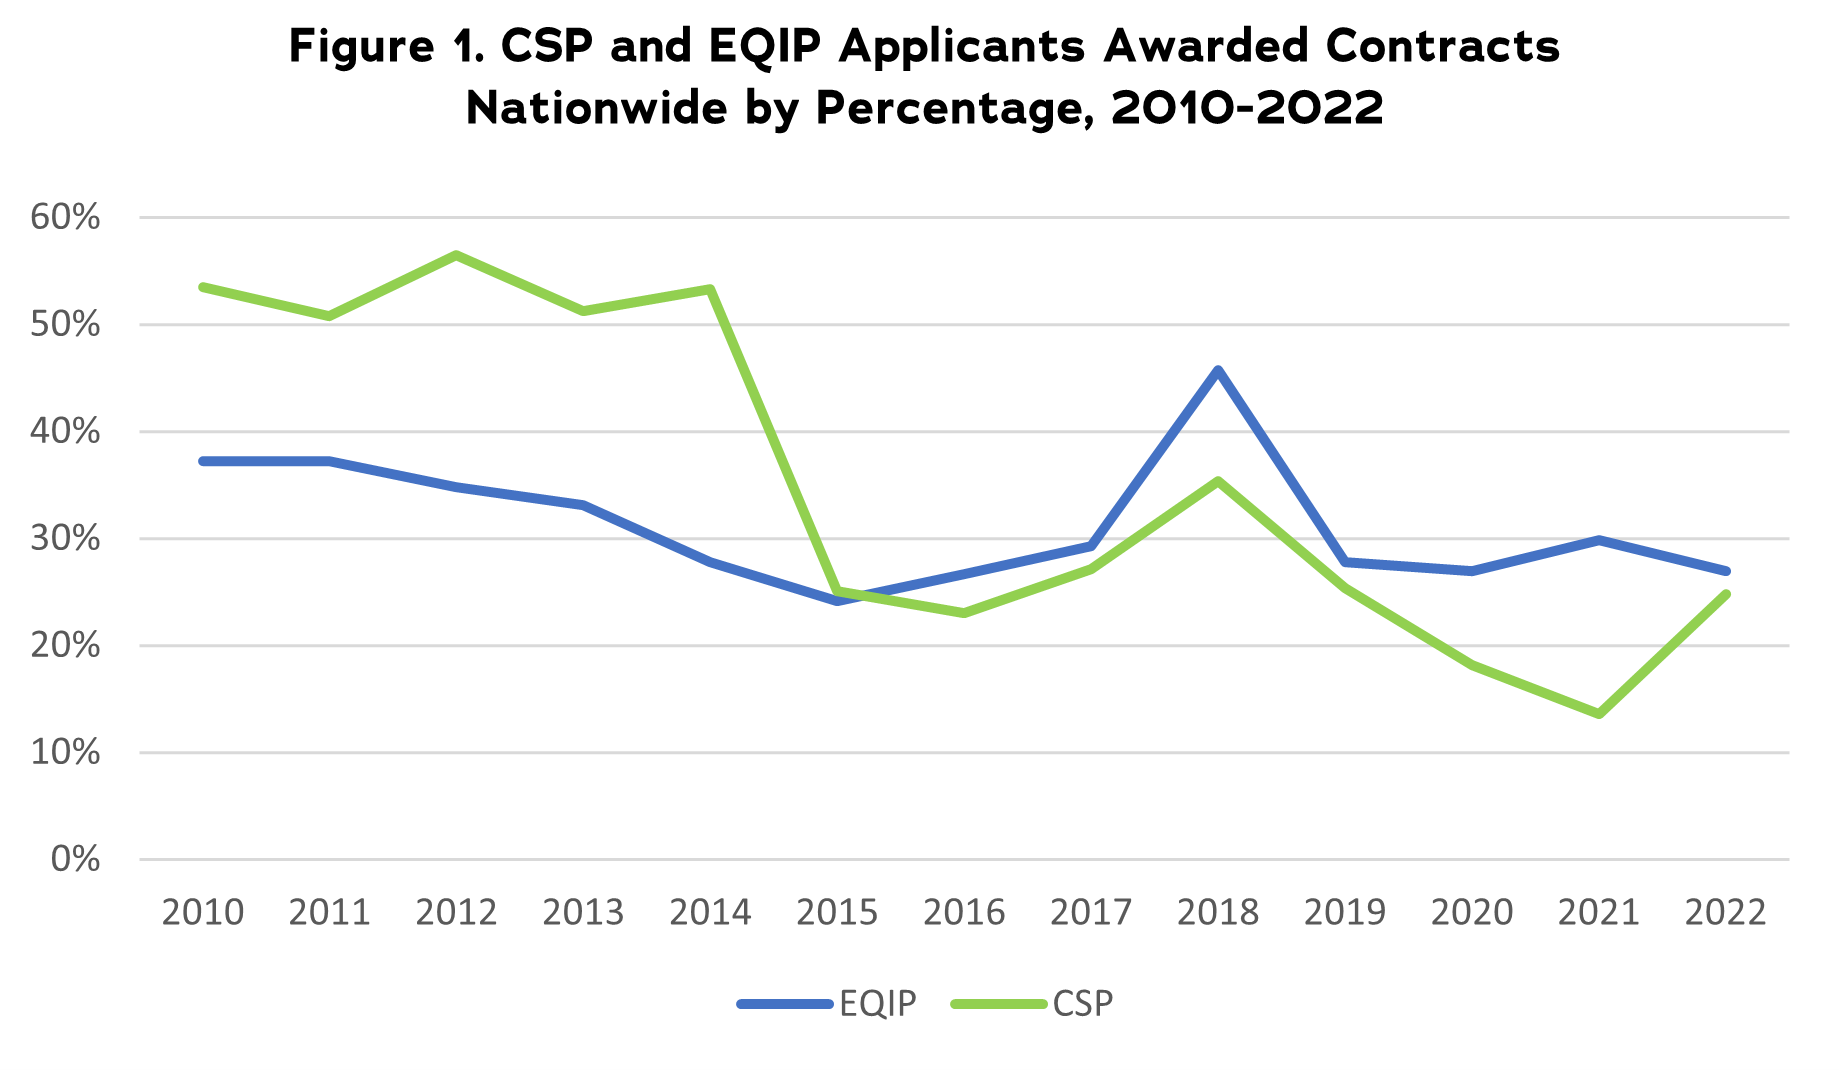
In just one year, between 2021 and 2022, the percentage of approved CSP applicants jumped 10%, all without an influx of new money from Congress. This increase could reflect several factors, including increased technical assistance capacity in local USDA offices, increased emphasis on CSP nationwide, more farmer-to-farmer conversations about the program and many other factors. It will be interesting to track trends over the next several years as funding from the Inflation Reduction Act enters the stream.
Has progress been made on outreach to farmers of color?
One way USDA could improve is in the data it collects; as it stands now, we simply do not have as much information as we would like on how conservation programs serve farmers of color in each state. We know how many EQIP contracts were awarded in each state to “socially disadvantaged producers” — USDA’s term for farmers of color — but we know neither how many applied in the first place, nor how many chose not to apply. We also do not know this information is broken down by race, and we must rely on anecdotes to know how these programs serve, for example, Native American communities or Hmong farmers in Minnesota. The United States farmer population is diverse with different needs for different farmers. It is important to know which groups of farmers USDA is serving well and where improvements can be made so outreach and service can be most useful.
Table 3 lists the number of contracts by state that go to farmers of color, as well as average contract size.
Table 3. Number of Contracts/Financial Assistance, EQIP, Socially Disadvantaged Producers, 202211
State
|
Number of Contracts
|
Financial Assistance
|
Average Contract Size
|
Contract Acres
|
Average Size, Acres
|
Alabama
|
297
|
$5,859,386
|
$19,729
|
32,179
|
108
|
Alaska
|
11
|
$7,138,771
|
$648,979
|
21,424
|
1,948
|
Arizona
|
37
|
$3,912,037
|
$105,731
|
100,795
|
2,724
|
Arkansas
|
257
|
$11,020,977
|
$42,883
|
22,738
|
88
|
California
|
461
|
$27,414,970
|
$59,468
|
39,831
|
86
|
Colorado
|
44
|
$3,363,634
|
$76,446
|
9,754
|
222
|
Connecticut
|
10
|
$274,789
|
$27,479
|
539
|
54
|
Delaware
|
37
|
$1,900,905
|
$51,376
|
586
|
16
|
Florida
|
103
|
$4,670,925
|
$45,349
|
30,006
|
291
|
Georgia
|
321
|
$10,692,625
|
$33,310
|
14,841
|
46
|
Hawaii
|
63
|
$5,649,740
|
$89,678
|
6,702
|
106
|
Idaho
|
21
|
$834,927
|
$39,758
|
1,371
|
65
|
Illinois
|
9
|
$686,548
|
$76,283
|
659
|
73
|
Indiana
|
20
|
$435,957
|
$21,798
|
651
|
33
|
Iowa
|
11
|
$548,917
|
$49,902
|
856
|
78
|
Kansas
|
30
|
$838,136
|
$27,938
|
4,271
|
142
|
Kentucky
|
30
|
$788,195
|
$26,273
|
1,646
|
55
|
Louisiana
|
85
|
$3,293,290
|
$38,745
|
7,730
|
91
|
Maine
|
21
|
$421,290
|
$20,061
|
2,405
|
115
|
Maryland
|
28
|
$520,919
|
$18,604
|
340
|
12
|
Massachusetts
|
11
|
$138,555
|
$12,596
|
60
|
5
|
Michigan
|
46
|
$2,430,099
|
$52,828
|
2,979
|
65
|
Minnesota
|
56
|
$1,457,714
|
$26,031
|
5,383
|
96
|
Mississippi
|
436
|
$8,037,971
|
$18,436
|
24,333
|
56
|
Missouri
|
98
|
$5,288,249
|
$53,962
|
8,666
|
88
|
Montana
|
77
|
$4,160,312
|
$54,030
|
109,486
|
1,422
|
Nebraska
|
10
|
$221,618
|
$22,162
|
1,745
|
174
|
Nevada
|
16
|
$2,407,916
|
$150,495
|
10,345
|
647
|
New Hampshire
|
18
|
$179,945
|
$9,997
|
54
|
3
|
New Jersey
|
19
|
$476,652
|
$25,087
|
371
|
20
|
New Mexico
|
119
|
$10,150,977
|
$85,302
|
254,183
|
2,136
|
New York
|
27
|
$735,396
|
$27,237
|
675
|
25
|
North Carolina
|
81
|
$3,922,471
|
$48,426
|
5,327
|
66
|
North Dakota
|
15
|
$399,167
|
$26,611
|
4,131
|
275
|
Ohio
|
35
|
$1,026,538
|
$29,330
|
1,330
|
38
|
Oklahoma
|
263
|
$8,752,337
|
$33,279
|
98,072
|
373
|
Oregon
|
29
|
$1,024,541
|
$35,329
|
2,737
|
94
|
Pennsylvania
|
12
|
$903,185
|
$75,265
|
447
|
37
|
Rhode Island
|
15
|
$327,721
|
$21,848
|
191
|
13
|
South Carolina
|
145
|
$5,186,010
|
$35,766
|
6,937
|
48
|
South Dakota
|
25
|
$3,124,007
|
$124,960
|
67,656
|
2,706
|
Tennessee
|
92
|
$2,678,483
|
$29,114
|
3,979
|
43
|
Texas
|
468
|
$14,512,170
|
$31,009
|
126,198
|
270
|
Utah
|
15
|
$878,266
|
$58,551
|
2,042
|
136
|
Vermont
|
13
|
$230,425
|
$17,725
|
178
|
14
|
Virginia
|
99
|
$4,434,534
|
$44,793
|
4,820
|
49
|
Washington
|
30
|
$3,555,833
|
$118,528
|
63,701
|
2,123
|
West Virginia
|
18
|
$641,353
|
$35,631
|
1,094
|
61
|
Wisconsin
|
61
|
$853,243
|
$13,988
|
5,086
|
83
|
Wyoming
|
19
|
$2,360,207
|
$124,221
|
28,090
|
1,478
|
Pacific Basin
|
46
|
$820,306
|
$17,833
|
138
|
3
|
Puerto Rico
|
206
|
$11,378,252
|
$55,234
|
7,387
|
36
|
Total
|
4,516
|
$192,961,388
|
$42,728
|
1,147,141
|
254
|
In Table 4, you can see data on the number of EQIP contracts awarded to farmers of color (coded as socially disadvantaged producers by USDA) compared to the total percentage of farmers classified as socially disadvantaged. In many cases in 2022, farmers of color received an outsized proportion of EQIP dollars, though there are still states where this gap is reversed (such as Arizona). This is good news, especially considering the decades of discrimination farmers of color have faced when interfacing with USDA and other federal agencies.
Data collection on farmer demographics and program usage needs to be improved. It remains difficult to determine how many Black, Native and Asian American farmers in each state are served by programs such as EQIP.
Nationwide, popular EQIP practices for farmers of color include prescribed grazing, brush management and fencing.
Table 4. Percentage of EQIP Contracts Awarded to Farmers of Color by State, 202212
State
|
% of EQIP Contracts Awarded to Farmers of Color
|
% of Total Farmers IDed as Socially Disadvantaged by Race
|
% of Total Farmers IDed as Socially Disadvantaged by Ethnicity (i.e., Hispanic/Latino)
|
Alabama
|
20.00%
|
8%
|
1%
|
Alaska
|
34.38%
|
4%
|
2%
|
Arizona
|
24.50%
|
58%
|
5%
|
Arkansas
|
17.66%
|
5%
|
19%
|
California
|
37.00%
|
7%
|
1%
|
Colorado
|
10.68%
|
2%
|
6%
|
Connecticut
|
12.66%
|
1%
|
1%
|
Delaware
|
23.27%
|
2%
|
1%
|
Florida
|
18.07%
|
6%
|
9%
|
Georgia
|
25.56%
|
5%
|
1%
|
Hawaii
|
61.17%
|
36%
|
6%
|
Idaho
|
4.38%
|
1%
|
3%
|
Illinois
|
2.43%
|
0%
|
1%
|
Indiana
|
2.34%
|
0%
|
1%
|
Iowa
|
1.34%
|
0%
|
1%
|
Kansas
|
4.46%
|
1%
|
1%
|
Kentucky
|
3.84%
|
1%
|
1%
|
Louisiana
|
16.87%
|
8%
|
2%
|
Maine
|
5.33%
|
2%
|
1%
|
Maryland
|
10.77%
|
3%
|
1%
|
Massachusetts
|
8.33%
|
2%
|
2%
|
Michigan
|
5.87%
|
1%
|
1%
|
Minnesota
|
6.20%
|
1%
|
1%
|
Mississippi
|
19.78%
|
14%
|
1%
|
Missouri
|
10.41%
|
1%
|
1%
|
Montana
|
16.52%
|
4%
|
1%
|
Nebraska
|
1.05%
|
3%
|
1%
|
Nevada
|
25.00%
|
6%
|
5%
|
New Hampshire
|
7.35%
|
Not available
|
Not available
|
New Jersey
|
7.39%
|
2%
|
3%
|
New Mexico
|
36.06%
|
21%
|
31%
|
New York
|
6.70%
|
1%
|
1%
|
North Carolina
|
16.01%
|
4%
|
1%
|
North Dakota
|
2.82%
|
1%
|
1%
|
Ohio
|
3.70%
|
0%
|
1%
|
Oklahoma
|
30.20%
|
11%
|
2%
|
Oregon
|
6.52%
|
2%
|
3%
|
Pennsylvania
|
2.75%
|
0%
|
1%
|
Rhode Island
|
12.61%
|
2%
|
1%
|
South Carolina
|
22.48%
|
8%
|
1%
|
South Dakota
|
6.61%
|
2%
|
1%
|
Tennessee
|
11.07%
|
2%
|
1%
|
Texas
|
15.58%
|
4%
|
10%
|
Utah
|
4.09%
|
4%
|
2%
|
Vermont
|
4.74%
|
1%
|
1%
|
Virginia
|
20.58%
|
3%
|
1%
|
Washington
|
11.07%
|
2%
|
4%
|
West Virginia
|
4.53%
|
2%
|
1%
|
Wisconsin
|
5.73%
|
1%
|
1%
|
Wyoming
|
7.92%
|
1%
|
2%
|
Pacific Basin
|
97.87%
|
Not available
|
Not available
|
Puerto Rico
|
86.55%
|
7%
|
99%
|
What policy solutions are needed?
-
Double Farm Bill spending on conservation.
-
Remove the 50% EQIP set aside for livestock practices.
-
Continue to improve outreach and access to credit and land for farmers of color.
-
Continue to improve outreach and access to credit and land for small, medium-sized and beginning farmers.
-
Incorporate the Agriculture Resilience Act and the Justice for Black Farmers Act into the Farm Bill.
-
Expand advanced payment options, including up to 100% of cost.
While much progress has been made in connecting farmers with EQIP and CSP over the last year, more needs to be done. We should build on the success of the Inflation Reduction Act to ensure consistent funding for conservation programs continues for decades to come. These programs provide much-needed economic buffer from the risks inherent in farming in the 21st century. IATP was among 216 farmer advocacy, conservation and climate organizations that called for a doubling of conservation spending at USDA in the next Farm Bill.13 This type of serious investment, along with a focus on agroecological practices, would go a long way in meeting the demand for programs such as CSP and EQIP while helping build resilience for thousands of farmers across the country.
USDA should build on the progress it has made in connecting conservation programs with farmers of color, as well as small, medium-sized and farms run by beginning farmers. Continuing to improve outreach, access to credit, clearer and more accessible public data, and expanding advanced payment options will help keep farmers on the land and connect conservation programs and climate-minded people with the opportunity to be stewards of the land.
IATP supports bills such as the Agriculture Resilience Act14 and the Justice for Black Farmers Act15 that both expand funding for climate resilience in agriculture and expand opportunities for farmers historically excluded from USDA programs. For such wide-ranging problems, we need comprehensive solutions.
It is important that resilience-minded farmers and community members participate in making decisions that can improve CSP and EQIP. We encourage readers of this report to engage with their U.S. Senators and Representatives on issues important to them during 2023 Farm Bill negotiations and beyond. We also encourage people to participate in their state and local Technical Advisory Committees through Natural Resources Conservation Service (NRCS), the conservation arm of USDA. In many states, these committees make implementation decisions, such as which natural resource concerns to prioritize and when to reach out to farmers and can provide more nuanced information on enrollment trends in a local area.
If we are to meet our climate goals as a country and as a planet, we will need more conservation-minded farmers able to properly steward their land without breaking the bank. Meeting the challenge of the climate crisis with the help of farmers and ranchers means many more resources are needed. We hope this report highlights this need and can better inform the debate.
Endnotes
1. National Sustainable Agriculture. Release: NRCS Announces Improvements to CSP and EQIP. https://sustainableagriculture.net/blog/release-nrcs-announces-improvements-to-csp-and-eqip/
2. Institute for Agriculture and Trade Policy. IATP comments on implementation of the Inflation Reduction Act. https://www.iatp.org/iatp-comments-implementation-inflation-reduction-act.
3. Congressional Research Service. Environmental Quality Incentives Program (EQIP): Status and Issues. https://crsreports.congress.gov/product/pdf/R/R40197/13.
4. Cornell Law School. 16 U.S. Code § 3839aa–2 - Establishment and administration. https://www.law.cornell.edu/uscode/text/16/3839aa-2.
5. Institute for Agriculture and Trade Policy. Payments for pollution: how federal conservation programs can better benefit farmers and the environment. https://www.iatp.org/documents/payments-pollution-how-federal-conservation-programs-can-better-benefit-farmers-and.
6. Institute for Agriculture and Trade Policy. Closed out: how farmers are denied access to conservation programs. https://www.iatp.org/documents/closed-out-how-us-farmers-are-denied-access-conservation-programs.
7. Natural Resources Conservation Service. Protracts 10 13 2022.
8. Ibid.
9. Ibid.
10. U.S. Government Publishing Office. Public Law 115-334: Agriculture Improvement Act of 2018. https://www.congress.gov/115/plaws/publ334/PLAW-115publ334.pdf.
11. Natural Resources Conservation Service. Protracts 10 13 2022.
12. Ibid.
13. August 4, 2021 Letter to Majority Leader Chuck Schumer and Speaker of the House Nancy Pelosi. https://www.nwf.org/-/media/Documents/PDFs/Press-Releases/2021/08-04-21_Letter-216-Groups-Call-for-Double-Ag-Cons-Funding.
14. U.S. Government Publishing Office. 117th Congress, 1st Session: H.R. 2803: To address the impact of climate change on agriculture, and for other purposes. https://www.congress.gov/117/bills/hr2803/BILLS-117hr2803ih.pdf.
15. U.S. Government Publishing Office. 118th Congress, 1st Session: S. 96: To address the history of discrimination against Black farmers and ranchers, to require reforms within the Department of Agriculture to prevent future discrimination, and for other purposes. https://www.congress.gov/118/bills/s96/BILLS-118s96is.pdf.
See also:
Downloads:
Download a PDF of this report here.