by
IATP, GRAIN and Heinrich Böll Stiftung

Methodology for Calculating the Emissions
The Methodology Involved a Three-step Process
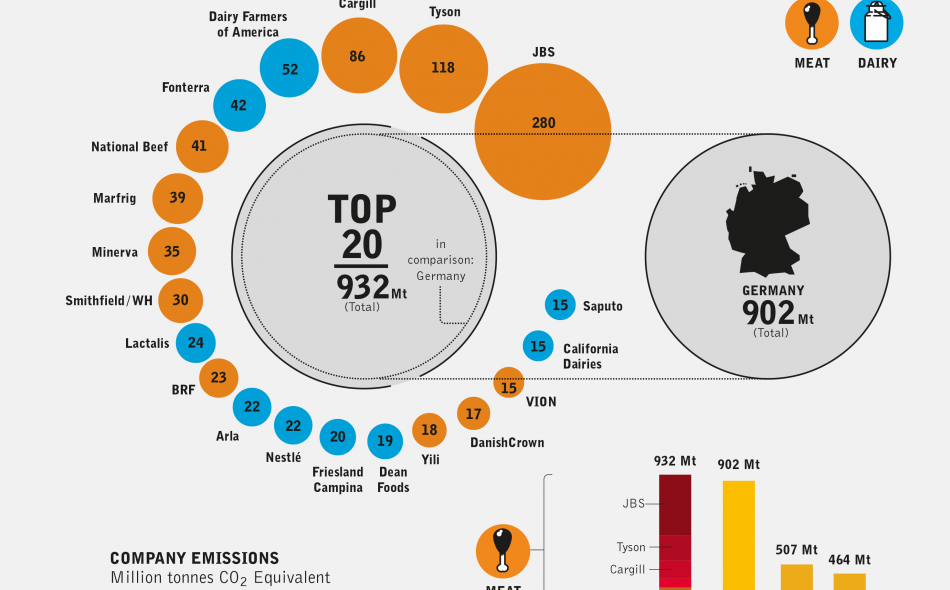
- Determining the quantity of meat and milk processed in the year 2016 by each company. We utilised public company reports wherever possible, as well as data generated by WATT (Pig International, Poultry Trends), IFCN and Sterling Marketing (personal communication). All numbers are for 2016, except for Marfrig (2015) and Bigard (2014), the latest years for which data is publicly available. For beef and poultry, we also determined the quantity of production per geographic region for each company, based on company reports.
- Using the FAO’s most recent GLEAM data (updated to 2010) to determine the per kilo GHG emissions for beef, pork, poultry and milk (emissions factors) for each company. For beef and poultry, these emissions factors included a regional breakdown of production per company, given the available company data on geographic production and the GLEAM model’s significant differences in emissions factors between regions. For pork and milk, we used global averages to generate emissions factors for each company, given the lack of available company data on geographic production and the small variations in emissions factors for industrial production provided by the GLEAM model for the relevant regions.
- Multiplying the production quantity by the emissions factors to get the totals for each company.
Data for the Infographics
- The data on country GHG emissions (excluding LULUCF) are from the OECD for 2015.
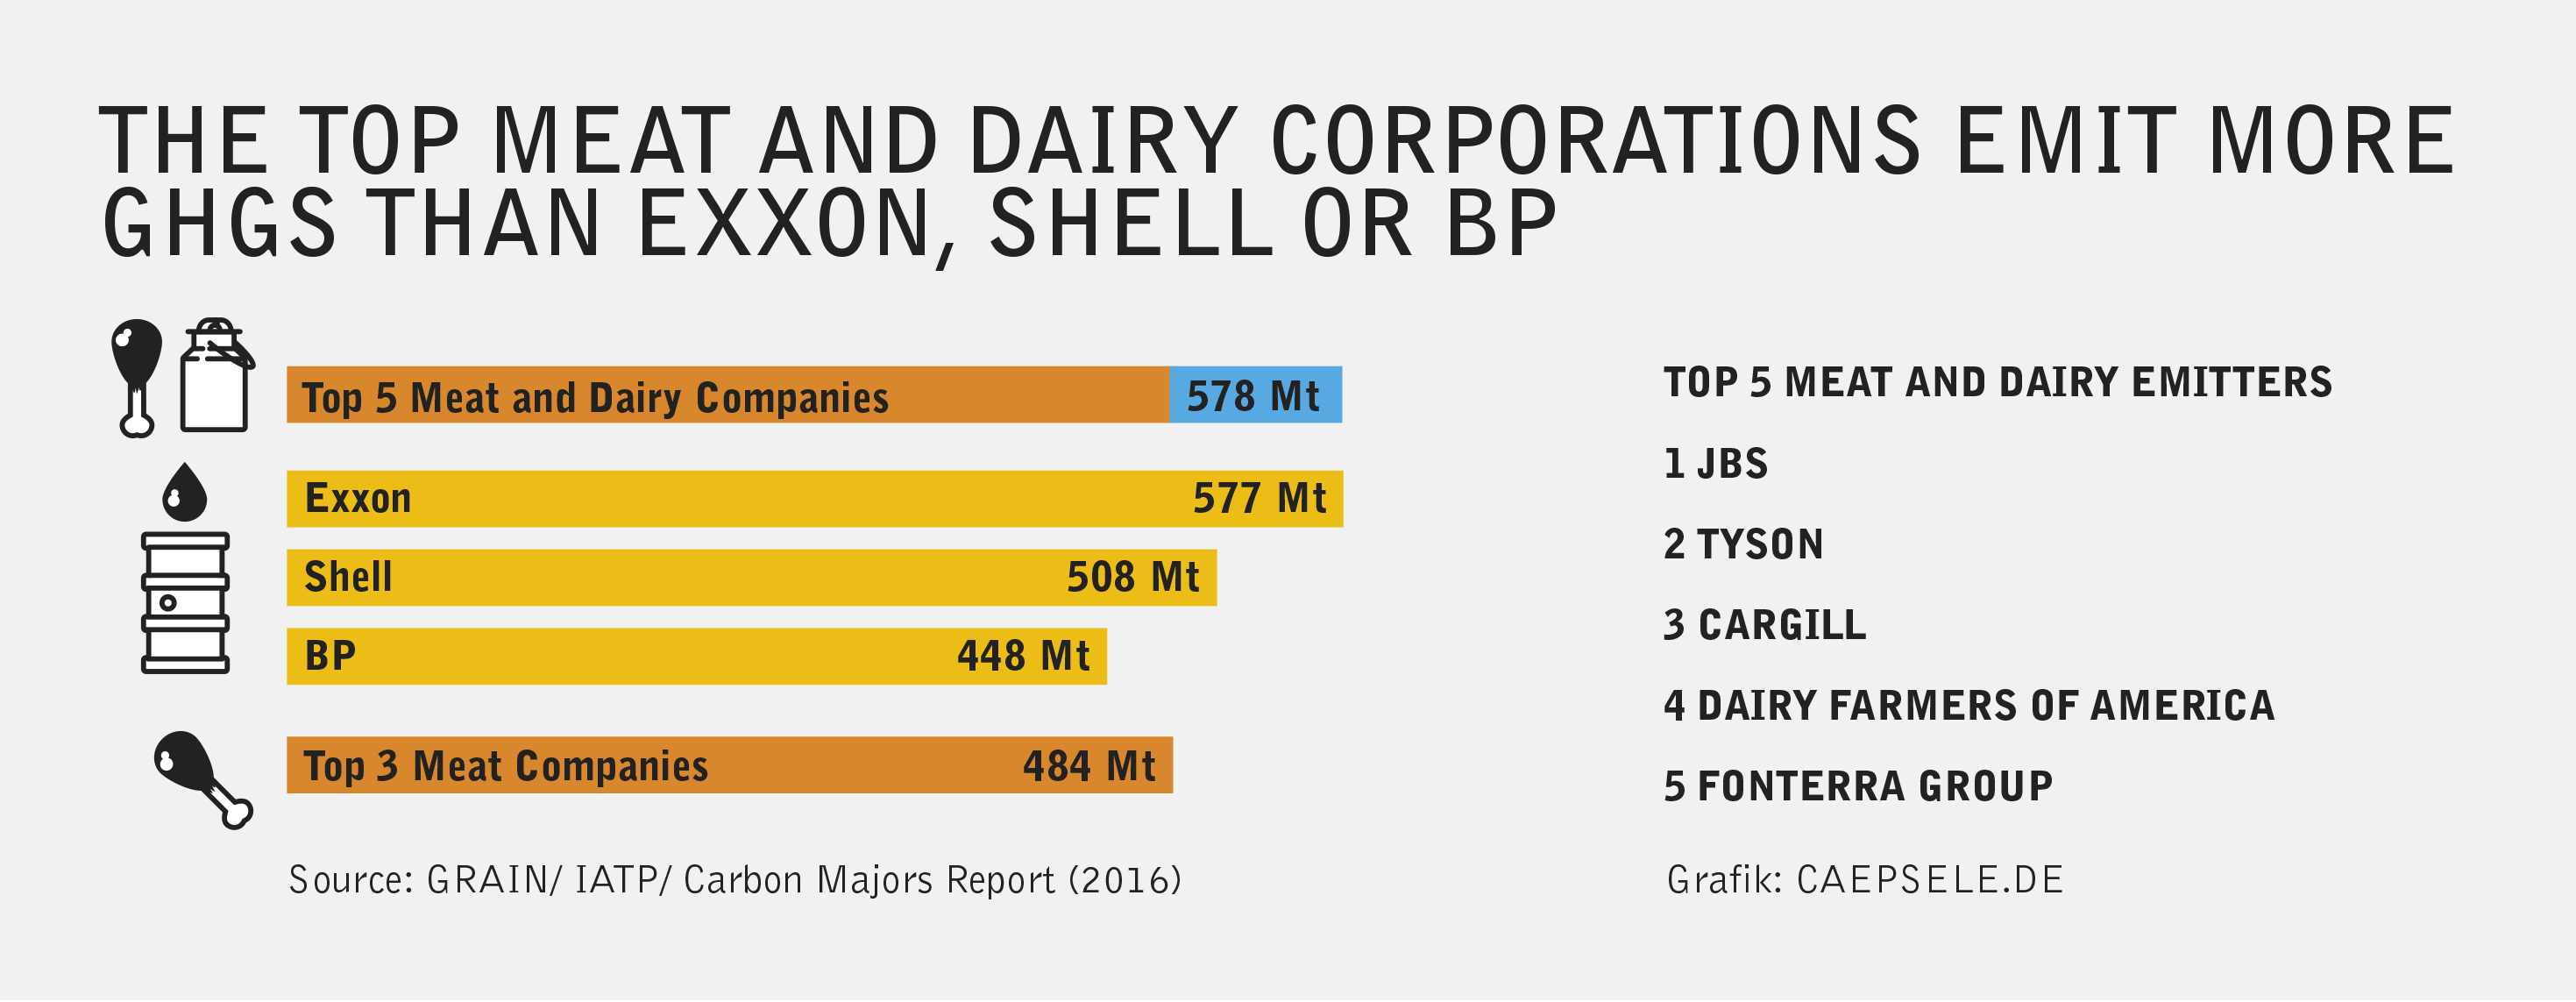
- The data on Scope 1 + Scope 3 emissions from fossil fuel companies are from CDP’s 2017 Carbon Majors Report.
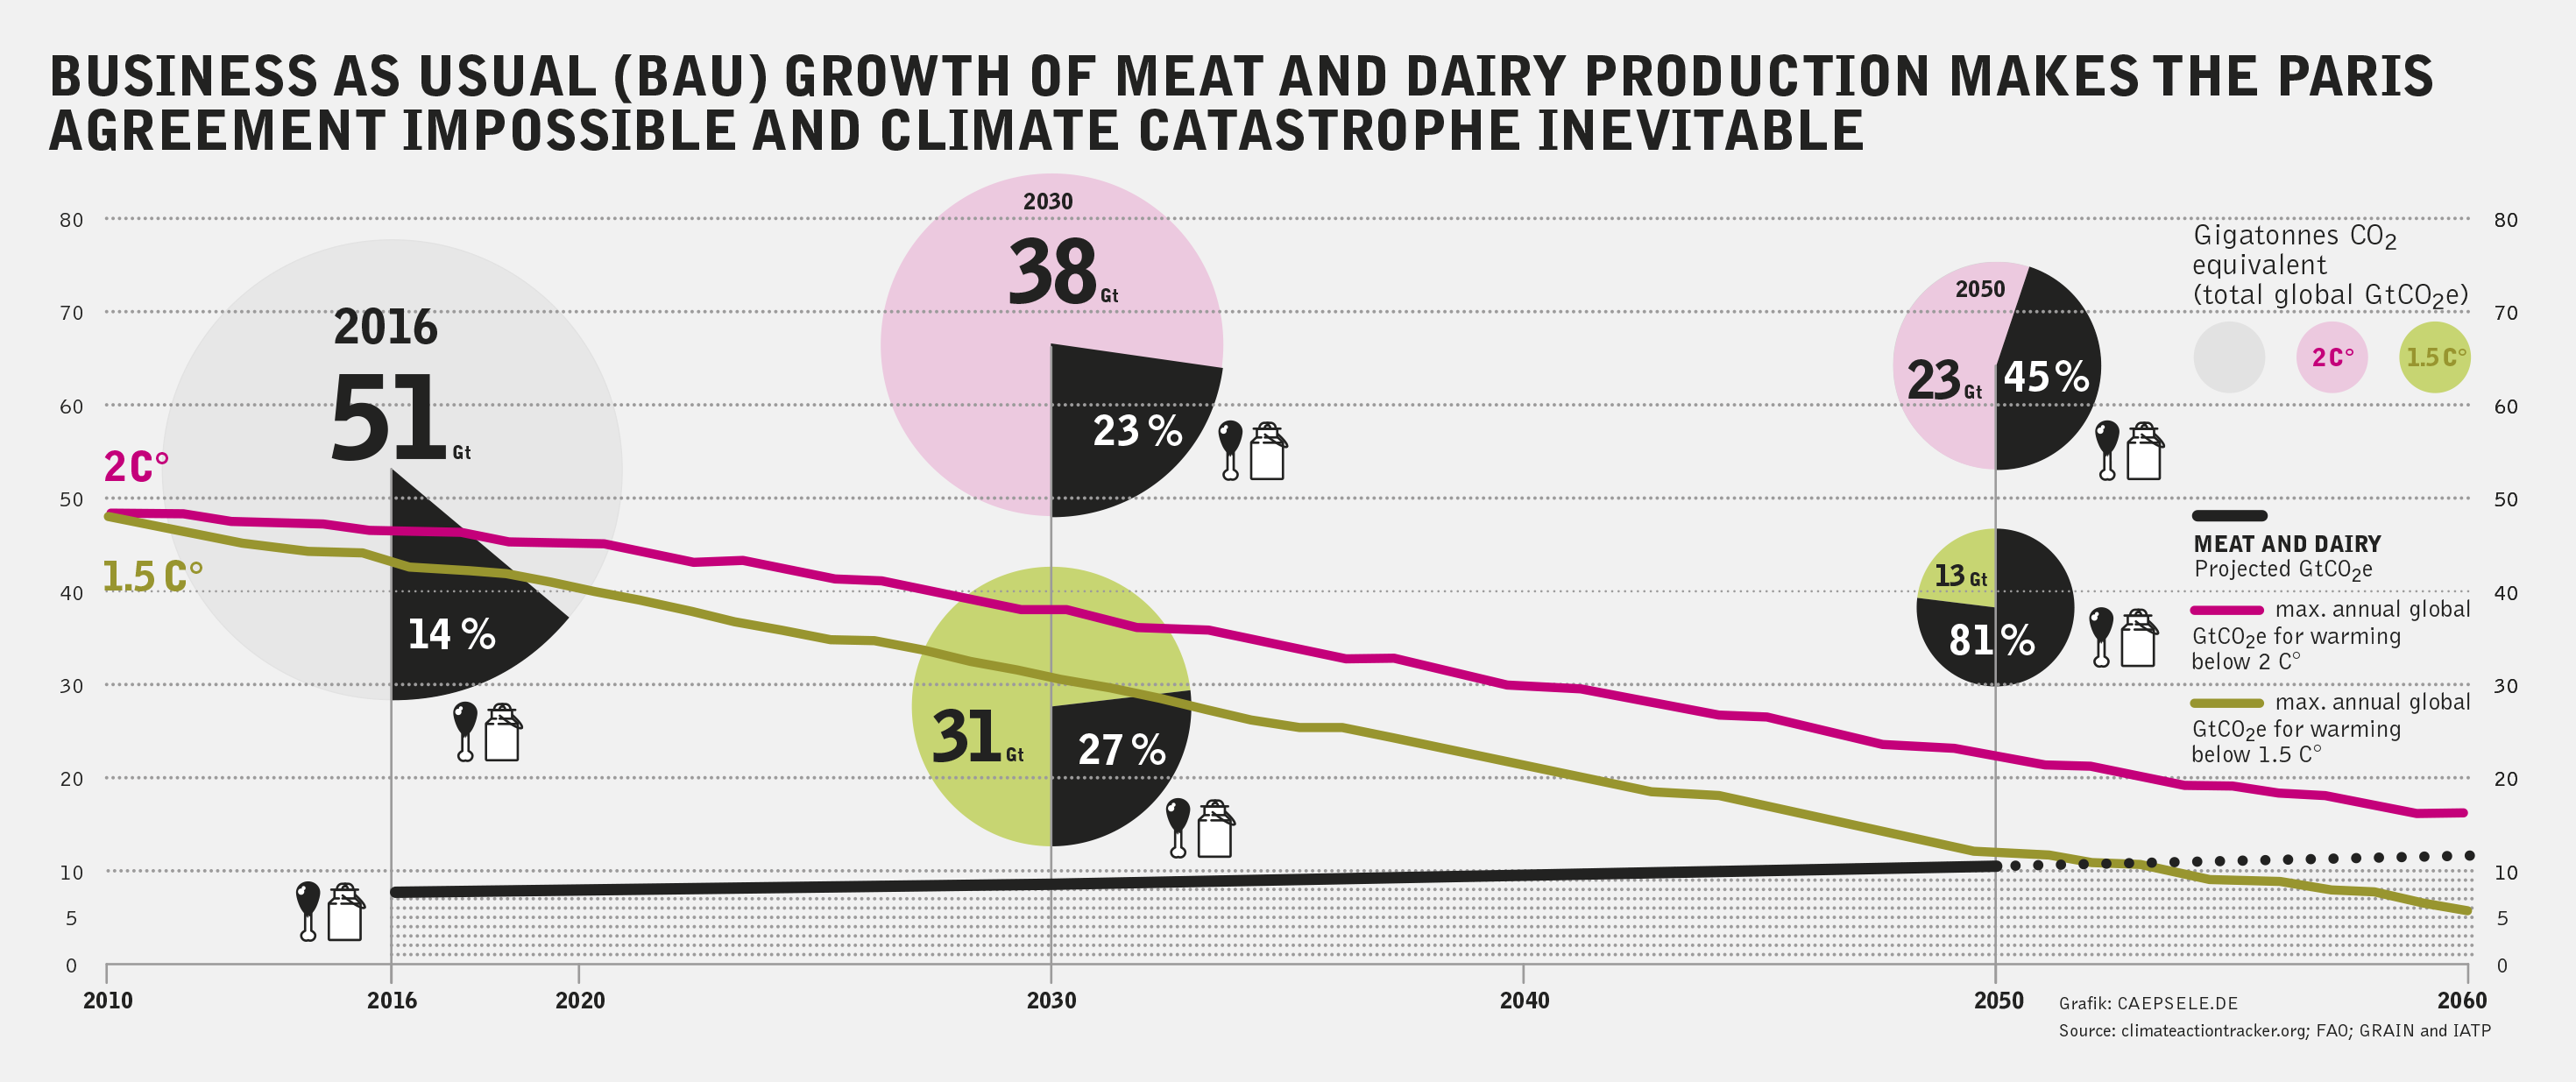
- The projections for global greenhouse gas emissions under a business as usual scenario and a less than +2 C° scenario are from Climate Tracker.
- The projected emissions from meat and dairy production from 2016 to 2050 are based on the FAO’s projections for global meat and milk production per category (beef, poultry, pork, milk, ovine and «other») and the FAO’s most recent estimates (2013) for global emissions per category. The relevant FAO documents are hyperlinked in the online version of this factsheet, but they include: Food Outlook June 2016; Tackling Climate Change Through Livestock.(2013); World Agriculture: Towards 2030 / 2050. The 2012 Revision.
- The figure for 2060 global emissions from meat and dairy (11.45 GtCO2e) assumes growth in meat and dairy production from 2050 – 2060 at the same rate as from 2030 – 2050. We did not include any assumptions for a reduction in emissions per kilo for meat and dairy production from 2016 – 2050 nor did we account for possible shifts in regional shares of global production or in types of production.
These infographics have been developed using data that will form part of a larger report to be released by IATP and GRAIN in 2018. Our objective in pre-releasing this selection of data is to help generate discussion about the issue at the COP 23 in Bonn, and to use the discussions and reactions that it generates to contribute to the 2018 report.
PUBLISHED BY Heinrich Böll Foundation, Institute for Agriculture & Trade Policy Europe and GRAIN; November 2017. This work is available under the Creative Commons »Attribution 4.0 International (CC BY 4.0)«license. The text of the license is available at creativecommons.org/licenses/by/4.0/de/legalcode. A summary (not a substitute) is available at creativecommons.org/licenses/by/4.0/deed.de. Kindly supported by CAEPSELE_visual strategies, caepsele.de
FOR MORE INFORMATION SEE www.grain.org/e/5825.
Download the infographic.
Find the full data here.
Lire la traduction française.
Lea la traducción al español.