The latest greenhouse gas emissions (GHG) data from the U.S. Environmental Protection Agency (EPA) show U S. emissions rising after a pandemic-induced dip, creating a tougher challenge for the Biden administration to reach its 2030 climate target. The data show overall emissions rose by more than 6% from 2020 to 2021, driven largely by an increase in carbon dioxide emissions from fossil fuel combustion linked to economic activity rebounding after the COVID-19 pandemic. Agriculture emissions, primarily linked to large-scale animal operations and nitrogen fertilizer use, continued a steady long-term climb by rising slightly in 2021.
The latest EPA numbers make achieving the Biden administration’s Paris Climate Commitment of a 50% emissions reduction (from 2005 levels) by 2030 more difficult. The EPA reported that U.S. GHGs in 2021 were only 16.3% below 2005 levels. The 2021 numbers represent the first year of the Biden administration but do not reflect action taken through the Infrastructure Investment and Jobs Act (late 2021) or the Inflation Reduction Act (2022), two major spending bills that incorporate climate goals. The IRA included an additional $20 billion for popular farm conservation programs that could bring climate benefits.
Agriculture emissions make up almost 9.3% of total U.S. emissions, reported the EPA. When combined with on-farm fossil fuel use, the percentage rises to 9.9% and the addition of on-farm electricity drives the total to10.5% of all GHG emissions. (p. 433). Agriculture greenhouse gas emissions are primarily methane (from ruminants and their manure) and nitrous oxide (from nitrogen fertilizer). The EPA reported that, “Between 1990 and 2021, CO2 (carbon dioxide) and CH4 (methane) emissions from agricultural activities increased by 16.2 percent and 15.7 percent, respectively, while N2O (nitrous oxide) emissions from agricultural activities fluctuated from year to year but increased by 4.1 percent overall.” (p. 423)
The EPA reported that fertilizer use (both synthetic and manure-based) for crop production contributed 48% of agriculture-related emissions and accounted for 74% of U.S. nitrous oxide emissions overall. The EPA report found that, “Direct N2O emissions from croplands occur throughout all of the cropland regions but tend to be high in the Midwestern Corn Belt Region (particularly, Illinois, Iowa, Kansas, Minnesota, Nebraska), where a large portion of the land is used for growing highly fertilized corn and N-fixing soybean crops.”(p.453) And “Indirect N2O emissions from surface runoff and leaching of applied/mineralized N in croplands is highest in the 8 Midwestern Corn Belt states.” (p.455) The EPA also reported that “Emissions from ammonia (fertilizer) production have increased since 2016, due to the addition of new ammonia production facilities and new production units at existing facilities.”
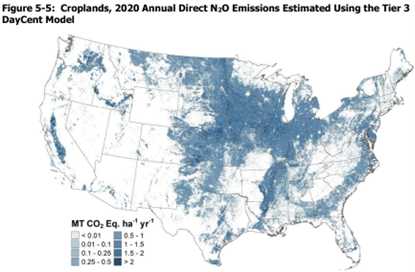
Source: EPA GHG Inventory, https://www.epa.gov/system/files/documents/2023-02/US-GHG-Inventory-2023-Main-Text.pdf, p. 454.
Emissions from enteric fermentation (ruminants’ digestive system) represented 33% of total agriculture emissions and 26% of total U.S. methane emissions in 2021, according to the EPA report. Manure represented 14% of total agriculture emissions and 9% of total methane emissions. (pp.115, 422) Manure-related nitrous oxide emissions have also increased, more than 40%, since 1990. (p.434)
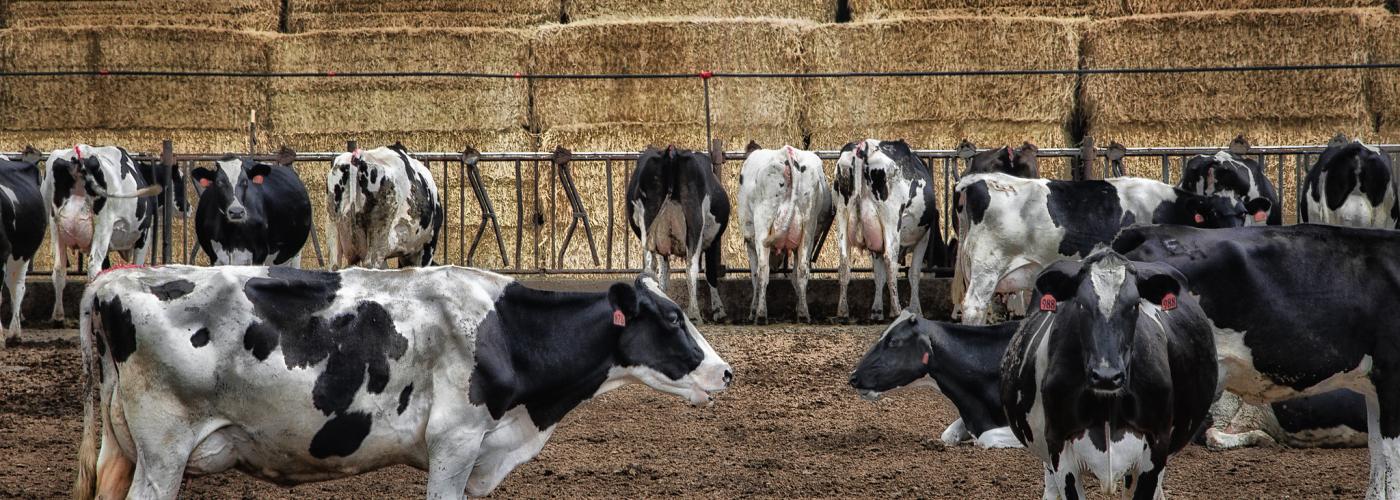
Methane emissions from enteric fermentation have increased 6.5% since 1990, largely following trends in the size of the U.S. cattle herd. But methane emissions from manure rose 69% since 1990, the EPA reported. “The majority of this increase (since 1990) is due to swine and dairy cow manure, where emissions increased 38 and 124 percent, respectively.” (p. 434)
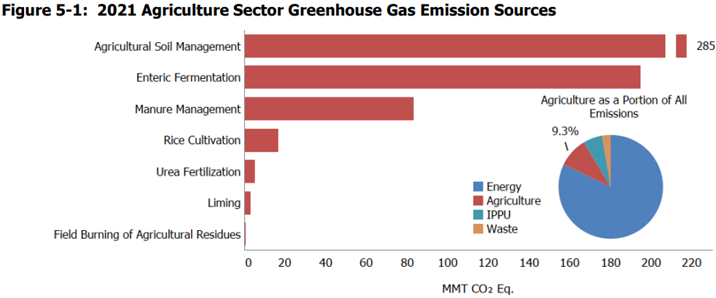
Source: EPA GHG Inventory, https://www.epa.gov/system/files/documents/2023-02/US-GHG-Inventory-2023-Main-Text.pdf, p. 422.
Agriculture emissions broken out by the greenhouse gases, methane and nitrous oxide
| Gas/Source |
1990 |
2005 |
2017 |
2018 |
2019 |
2020 |
2021 |
| CH4 |
240.4 |
263.7 |
277.5 |
281.2 |
280.4 |
281.0 |
278.2 |
|
Enteric Fermentation
|
183.1 |
188.2 |
195.9 |
196.8 |
197.3 |
196.2 |
194.9 |
|
Manure Management
|
39.0 |
54.9 |
64.4 |
66.5 |
65.7 |
66.7 |
66.0 |
| |
|
|
|
|
|
|
|
| N2O |
290.9 |
295.4 |
315.7 |
329.4 |
315.7 |
297.0 |
302.8 |
|
Agricultural Soil Management
|
278.4 |
280.8 |
298.7 |
312.1 |
298.2 |
279.3 |
285.2 |
|
Manure Management
|
12.4 |
14.5 |
16.9 |
17.2 |
17.4 |
17.5 |
17.4 |
Source: Ibid, p. 424.
While methane emissions for enteric fermentation stayed flat for beef cattle, such emissions rose for dairy cattle. In the past 30 years, mega-dairies have replaced hundreds of thousands of small and mid-sized dairies. Dairy cattle methane emissions rose 13% since 1990, even as the dairy cattle population has declined by 3.5%. (p. 426) The rise in dairy emissions is linked to a shift toward liquified manure systems on these large-scale mega-dairy operations.
The EPA reported, “While national dairy animal populations have decreased since 1990, some states have seen increases in their dairy cattle populations as the industry becomes more concentrated in certain areas of the country and the number of animals contained on each facility increases. These areas of concentration, such as California, New Mexico, and Idaho, tend to utilize more liquid-based systems to manage (flush or scrape) and store manure. Thus, the shift toward larger dairy cattle and swine facilities since 1990 has translated into an increasing use of liquid manure management systems, which have higher potential CH4 emissions than dry systems…In many cases, manure management systems with the most substantial methane emissions are those associated with confined animal management operations where manure is handled in liquid-based systems.” (p.434)
The shift toward large-scale, concentrated hog operations, and their liquid manure systems, has also played a role in rising manure-based methane emissions. See below the dramatic shift in the size of hog farms since 1997.
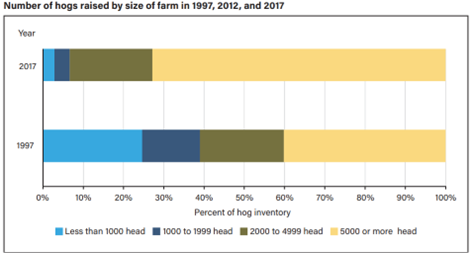
Source: USDA Economic Research Service, Increasing the Value of Animal Manure for Farmers, www.ers.usda.gov/webdocs/publications/106089/ap-109.pdf.
In addition, the EPA reported on the country’s carbon storage capacity. The Biden administration’s net zero by 2050 strategy depends partially on U.S. forest, grassland and agriculture land to capture carbon. But the U.S. has been losing carbon storage capacity since 1990, due to a steady loss of forest, grassland and farmland. The EPA reported: “Total net C sequestration in the LULUCF (Land use, Land use change and Forestry) sector decreased by approximately 11.4 percent between 1990 and 2021. This decrease was primarily due to a decline in the rate of net C accumulation in Forest Land, as well as an increase in emissions from Land Converted to Settlements (farmland lost to development).” (p.488)
The Biden administration’s climate target to reach a 50% reduction by 2030 and net zero by 2050 is ambitious and necessary. However, the latest EPA data show the country is far from meeting these targets — and took a step back in 2021. The 2021 Infrastructure bill and the 2022 Inflation Reduction Act will make major new investments in renewable energy, farm conservation and regionalized and local food systems. So far, the U.S.’ story of climate action has largely been characterized by ambitious pledges and dramatic projections of GHG reductions, but the trends in U.S. GHG data tell a different story: The U.S. is still off track to meet its 2030 target.