Today, we’re introducing the Meat and Dairy Emissions Dashboard, a database of major meat and dairy companies’ climate-related risk and emissions reporting.
Click here to access the Dashboard!
Why now?
The global food and agriculture system is responsible for a significant portion (roughly a third) of global greenhouse gas (GHG) emissions, including the potent GHG methane. Methane has about 80 times more global warming potency than carbon dioxide but is shorter-lived in the atmosphere. Due to its shorter lifespan of about 12 years, a rapid reduction of methane emissions is considered the most cost-effective way for humanity to avoid the worst effects of climate change.
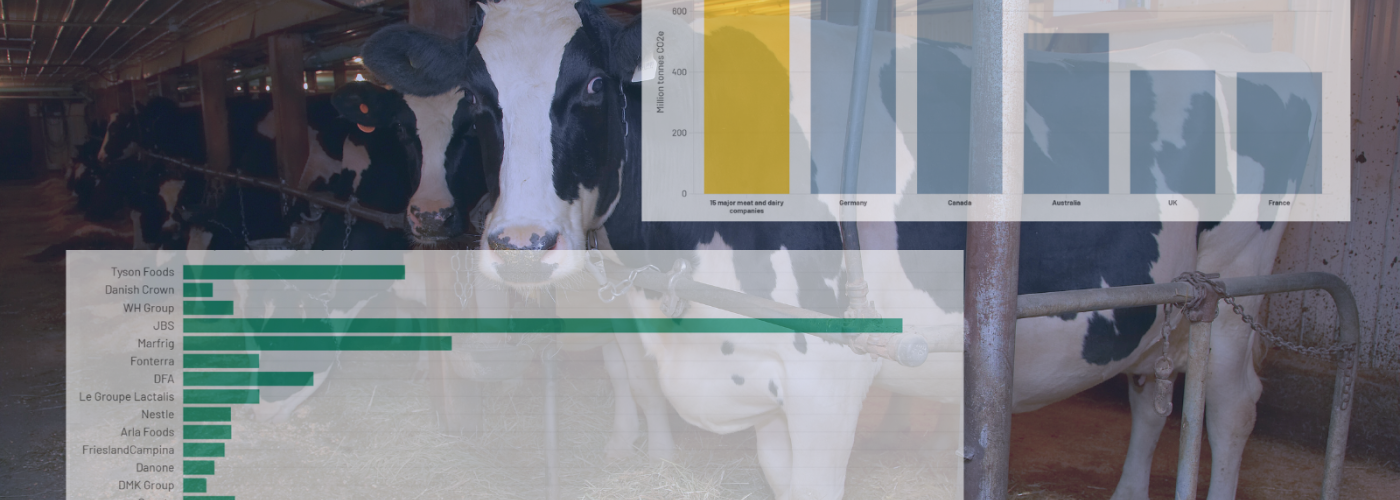
The livestock sector is the single-largest contributor to global methane emissions (32%). For decades, meat and dairy companies have pumped staggering amounts of GHGs including methane into the atmosphere. In fact, research by IATP and the Changing Markets Foundation found that the combined emissions of the 15 major meat and dairy companies exceed those of oil companies such as ExxonMobil, BP, and Shell.
Until recently, meat and dairy companies had mostly evaded responsibility to report or reduce their emissions. But that’s starting to change. Jurisdictions around the world have introduced corporate climate-related disclosure rules that make reporting on climate risk and emissions mandatory for a large swath of the global economy – including major meat and dairy companies.
As mandatory climate-related disclosure becomes a reality for major meat and dairy companies, we want to track meat and dairy companies’ disclosure and what it means for progress toward global climate goals. That’s why we created the Dashboard.
What the Dashboard is
The Dashboard is a database of major meat and dairy companies’ climate-related risk and emissions reporting. Company-reported emissions data, climate-risk reporting, and reports going back to 2021 are included in the Dashboard’s 23 company-level variables. It’s also a resource for tracking and learning more about climate-related disclosure rules and the frameworks they’re based on, with 20 climate-related disclosure rules analyzed. The Dashboard features interactive graphics created using our open-source dataset. Where relevant, it also provides direct links to source material.
What the Dashboard isn’t
The Dashboard does not contain an exhaustive list of climate-related disclosure rules, nor should it be considered the ultimate authority on disclosure rules or company-reported climate information. We have taken pains to ensure that the data in the Dashboard is as accurate as possible, but links to source texts have been provided in the hope that users use them to verify and supplement the information provided in the Dashboard. Analysis of which proposed climate-related disclosure rules will affect which companies is based on our best assessments using the available information. The Dashboard is confined to using publicly available data and therefore faces limitations of data availability.
What to expect
The version of the Dashboard published today is what we’re calling the “starter pack” — a basic collection of data, graphs, and relevant information to get users started. We will update the Dashboard with the latest information on a regular basis, and eventually we hope to expand the Dashboard to cover more companies. We will also periodically provide fresh analysis using the Dashboard data, either in the form of articles, reports, or new graphs. Everything published on the Dashboard is open source, but we ask that you give credit to IATP when you use it.
How to use the Dashboard in your work
The Dashboard will be useful to researchers, journalists, policymakers, and investors wanting to learn more about meat and dairy companies’ climate reporting and exposure to climate disclosure laws around the world. The Dashboard provides direct links to company reports and relevant policies so that users can investigate source texts. As more data is added over time, the Dashboard can be used to track how meat and dairy companies’ reporting changes in response to climate laws, and to track companies’ emissions over time.
We’ll be tweaking this as we go to make it as useful as possible. If you have feedback or suggestions, want to collaborate with us, or think we missed something, you can email us at climateteam(at)iatp.org.
Click here to access the Dashboard now!